Aviva 2009 Annual Report Download - page 9
Download and view the complete annual report
Please find page 9 of the 2009 Aviva annual report below. You can navigate through the pages in the report by either clicking on the pages listed below, or by using the keyword search tool below to find specific information within the annual report.-
 1
1 -
 2
2 -
 3
3 -
 4
4 -
 5
5 -
 6
6 -
 7
7 -
 8
8 -
 9
9 -
 10
10 -
 11
11 -
 12
12 -
 13
13 -
 14
14 -
 15
15 -
 16
16 -
 17
17 -
 18
18 -
 19
19 -
 20
20 -
21
-
22
-
23
-
24
-
25
-
26
-
27
-
28
-
29
-
30
-
31
-
32
-
33
-
34
-
35
-
36
-
37
-
38
-
39
-
40
-
41
-
42
-
43
-
44
-
45
-
46
-
47
-
48
-
49
-
50
-
51
-
52
-
53
-
54
-
55
-
56
-
57
-
58
-
59
-
60
-
61
-
62
-
63
-
64
-
65
-
66
-
67
-
68
-
69
-
70
-
71
-
72
-
73
-
74
-
75
-
76
-
77
-
78
-
79
-
80
-
81
-
82
-
83
-
84
-
85
-
86
-
87
-
88
-
89
-
90
-
91
-
92
-
93
-
94
-
95
-
96
-
97
-
98
-
99
-
100
-
101
-
102
-
103
-
104
-
105
-
106
-
107
-
108
-
109
-
110
-
111
-
112
-
113
-
114
-
115
-
116
-
117
-
118
-
119
-
120
-
121
-
122
-
123
-
124
-
125
-
126
-
127
-
128
-
129
-
130
-
131
-
132
-
133
-
134
-
135
-
136
-
137
-
138
-
139
-
140
-
141
-
142
-
143
-
144
-
145
-
146
-
147
-
148
-
149
-
150
-
151
-
152
-
153
-
154
-
155
-
156
-
157
-
158
-
159
-
160
-
161
-
162
-
163
-
164
-
165
-
166
-
167
-
168
-
169
-
170
-
171
-
172
-
173
-
174
-
175
-
176
-
177
-
178
-
179
-
180
-
181
-
182
-
183
-
184
-
185
-
186
-
187
-
188
-
189
-
190
-
191
-
192
-
193
-
194
-
195
-
196
-
197
-
198
-
199
-
200
-
201
-
202
-
203
-
204
-
205
-
206
-
207
-
208
-
209
-
210
-
211
-
212
-
213
-
214
-
215
-
216
-
217
-
218
-
219
-
220
-
221
-
222
-
223
-
224
-
225
-
226
-
227
-
228
-
229
-
230
-
231
-
232
-
233
-
234
-
235
-
236
-
237
-
238
-
239
-
240
-
241
-
242
-
243
-
244
-
245
-
246
-
247
-
248
-
249
-
250
-
251
-
252
-
253
-
254
-
255
-
256
-
257
-
258
-
259
-
260
-
261
-
262
-
263
-
264
-
265
-
266
-
267
-
268
-
269
-
270
-
271
-
272
-
273
-
274
-
275
-
276
-
277
-
278
-
279
-
280
-
281
-
282
-
283
-
284
-
285
-
286
-
287
-
288
-
289
-
290
-
291
-
292
-
293
-
294
-
295
-
296
-
297
-
298
-
299
-
300
-
301
-
302
-
303
-
304
-
305
-
306
-
307
-
308
-
309
-
310
-
311
-
312
-
313
-
314
-
315
-
316
-
317
-
318
-
319
-
320
-
321
-
322
-
323
-
324
-
325
-
326
-
327
-
328
 |
 |

07
100
200
300
100
400
Performance review
Aviva plc Group strategy continued
Corporate responsibility
Annual Report and Accounts 2009
Governance
Shareholder information
Financial statements IFRS
Financial statements MCEV
Other information
Our strategy and priorities need to be responsive to any changes in the external environment that may provide opportunities or
cause strategic risks. These potential changes include capital market developments, an evolving regulatory environment, changes
in the competitive landscape, development of major trends (such as climate change, changing consumer behaviour and improving
longevity) or the emergence of potential discontinuities (such as a pandemic).
We manage these risks and opportunities through disciplined risk management. For further details refer to the risk
management section on pages 56 to 59.
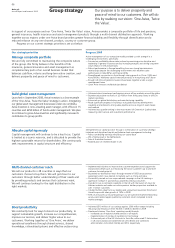
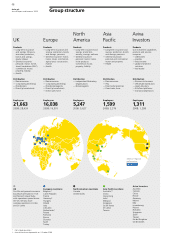
Summary of regional
strategic priorities
UK
Market leadership
— Drive up profitability
— Generate capital
— Insurance excellence
— Operational excellence
l 12 – 13
Europe
— Scale, growth, capital
— Seize unique growth
opportunities
— ‘One Europe’ operating model
— Generate capital
l 14 – 15
North America
Profitable growth
— Optimise business mix, growth
and margin
— Diversify distribution and products
— Generate net capital returns
l 16
Asia Pacific
Scale, growth
— Prioritised portfolio
— Regional operating model
— Investment required
l 17
Aviva Investors
— Globally integrated business
— Transform the investment model
— Increase third party business
l 18
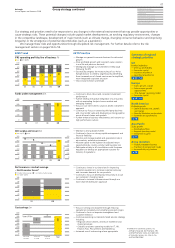
2009 Trend 2010 Priorities
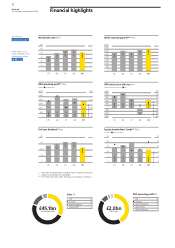
IFRS operating profit by line of business %
— Manage our general insurance business for value and
FM
growth
Life GIH
— Drive profitable growth and long-term value creation
80
61 5
53 5
37 6
40 4
32 5
60
40
57
56
63
20
34
42
0
in our life and pensions business
— Strategically manage our investment in Delta Lloyd
following the IPO
— Successfully progress the restructuring of our Aviva
Europe division to create a single business benefiting
from increased use of shared services and a simplified,
more integrated corporate structure
— Grow Aviva Investors worldwide
05 06 07 08 09
Funds under management £m
— Continue to drive robust and consistent investment
performance
— Further develop the global integration of our business
with an expanding footprint across mature and
100
335
349
359
304
across all asset classes and markets
— Further enhance business effectiveness and nurture our
0
high performance culture
06 07 08 09
IGD surplus and cover £bn
— Maintain a strong balance sheet
Cover
— Continue to focus on strong capital management and
financial flexibility
IGD surplus
5.0 2.0
— Monitor and manage market and operational risks in
1.6
an uncertain, external environment
4.0
— Allocate capital to the highest risk-adjusted return
emerging markets
— Focus on our client-centric solutions driven investment
approach
— Continue our focus on attracting third party business
and cross border sales and developing a strong pipeline
3.0 1.2
s)
2.0 0.8
r (time
1.0 0.4
d cove
0
3.5
3.5
2.9
2.0
0
Dividen
4.5
opportunities by country, product and business line
— Participate actively in all consultations with European
regulators to develop an appropriate outcome for
Solvency II regulations
05 06 07 08 09
Performance v market average
–
Net Promoter Score
©
% below market average % at or above market average
% in upper quartile
80
60
40
20
0
— Continue to invest in our brand and in improving
customer experience to increase customer advocacy
and consumer demand for our products
— Continue to focus on developing new products to suit
our customers’ changing needs
— Continue to increase customer access through our
multi-channel distribution approach
08 09
Cost savings £m
— Focus on strong cost discipline through reducing
operational complexity and simplifying product ranges
600
— Continue to focus on expense management and
customer retention
35
500 Target: £500m
340
170
545
Finance, Risk, Procurement and Marketing © 2006-2010 Satmetrix Systems, Inc.
100
All Rights Reserved. Net Promoter, NPS
and Net Promoter Score are trademarks
— Increased use of outsourcing where appropriate
0
of Satmetrix Systems Inc., Bain & Co.,
Achieved Achieved Expected Total
and Fred Reichheld
to 2008 in 2009 in 2010
— Continue executing our tailored shared services strategy
including:
– Regional service centres, centres of excellence and
shared processes
– Globally consistent operating models for IT, HR,
200
400
300