Aviva 2009 Annual Report Download - page 12
Download and view the complete annual report
Please find page 12 of the 2009 Aviva annual report below. You can navigate through the pages in the report by either clicking on the pages listed below, or by using the keyword search tool below to find specific information within the annual report.-
 1
1 -
 2
2 -
 3
3 -
 4
4 -
 5
5 -
 6
6 -
 7
7 -
 8
8 -
 9
9 -
 10
10 -
 11
11 -
 12
12 -
 13
13 -
 14
14 -
 15
15 -
 16
16 -
 17
17 -
 18
18 -
 19
19 -
 20
20 -
 21
21 -
 22
22 -
23
-
24
-
25
-
26
-
27
-
28
-
29
-
30
-
31
-
32
-
33
-
34
-
35
-
36
-
37
-
38
-
39
-
40
-
41
-
42
-
43
-
44
-
45
-
46
-
47
-
48
-
49
-
50
-
51
-
52
-
53
-
54
-
55
-
56
-
57
-
58
-
59
-
60
-
61
-
62
-
63
-
64
-
65
-
66
-
67
-
68
-
69
-
70
-
71
-
72
-
73
-
74
-
75
-
76
-
77
-
78
-
79
-
80
-
81
-
82
-
83
-
84
-
85
-
86
-
87
-
88
-
89
-
90
-
91
-
92
-
93
-
94
-
95
-
96
-
97
-
98
-
99
-
100
-
101
-
102
-
103
-
104
-
105
-
106
-
107
-
108
-
109
-
110
-
111
-
112
-
113
-
114
-
115
-
116
-
117
-
118
-
119
-
120
-
121
-
122
-
123
-
124
-
125
-
126
-
127
-
128
-
129
-
130
-
131
-
132
-
133
-
134
-
135
-
136
-
137
-
138
-
139
-
140
-
141
-
142
-
143
-
144
-
145
-
146
-
147
-
148
-
149
-
150
-
151
-
152
-
153
-
154
-
155
-
156
-
157
-
158
-
159
-
160
-
161
-
162
-
163
-
164
-
165
-
166
-
167
-
168
-
169
-
170
-
171
-
172
-
173
-
174
-
175
-
176
-
177
-
178
-
179
-
180
-
181
-
182
-
183
-
184
-
185
-
186
-
187
-
188
-
189
-
190
-
191
-
192
-
193
-
194
-
195
-
196
-
197
-
198
-
199
-
200
-
201
-
202
-
203
-
204
-
205
-
206
-
207
-
208
-
209
-
210
-
211
-
212
-
213
-
214
-
215
-
216
-
217
-
218
-
219
-
220
-
221
-
222
-
223
-
224
-
225
-
226
-
227
-
228
-
229
-
230
-
231
-
232
-
233
-
234
-
235
-
236
-
237
-
238
-
239
-
240
-
241
-
242
-
243
-
244
-
245
-
246
-
247
-
248
-
249
-
250
-
251
-
252
-
253
-
254
-
255
-
256
-
257
-
258
-
259
-
260
-
261
-
262
-
263
-
264
-
265
-
266
-
267
-
268
-
269
-
270
-
271
-
272
-
273
-
274
-
275
-
276
-
277
-
278
-
279
-
280
-
281
-
282
-
283
-
284
-
285
-
286
-
287
-
288
-
289
-
290
-
291
-
292
-
293
-
294
-
295
-
296
-
297
-
298
-
299
-
300
-
301
-
302
-
303
-
304
-
305
-
306
-
307
-
308
-
309
-
310
-
311
-
312
-
313
-
314
-
315
-
316
-
317
-
318
-
319
-
320
-
321
-
322
-
323
-
324
-
325
-
326
-
327
-
328
 |
 |

10
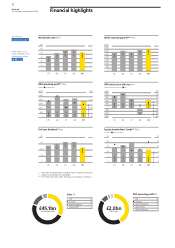
Aviva plc Key performance The key measures that are used by the
board and executive management team to
Annual Report and Accounts 2009
indicators assess performance at a group level are set
out below.
Earnings per share Pence
Earnings per share Relevancy
Our IFRS earnings per share for 2009 was 37.8 — To demonstrate our
100
commitment to ‘One Aviva,
pence (
2008: 36.8 pence loss
). This mainly reflects Twice the Value’ we are
(40)
(20)
20
0
60
80
40
73.5
88.0
48.9
(36.8)
37.8
the improvement in financial markets in 2009.
Economic and investment return assumptions during
the year were in line with our long-term expectations
with a positive variance of £77 million (
2008:
£2,544 million adverse
).
aiming to double earnings
per share by 2012.
— This ambition is based on
total IFRS return, including
investment volatility and
non-operating items over the
weighted average number
of shares.
Proposed ordinary dividend per share and
dividend cover
Our board has recommended a final dividend of 15.00
pence per share (
2008: 19.91 pence
). This brings the
total dividend for the year to 24.00 pence and a
dividend cover of 1.8 times (
2008: 1.9 times
) based on
IFRS operating earnings after tax.
— Our intention is to pay a
dividend on a basis judged
prudent using dividend cover
of 1.5-2.0 times, while
retaining capital to fund
future growth.
(60)
05 06 07 08 09
Proposed ordinary dividend per share
and dividend cover Pence
Dividend Cover
35.0
30.0 3.00
25.0 2.50
20.0 2.00
This is in line with last year’s decision to reduce the
15.0
Dividend cover (times)
27.27
30.00
33.00
33.00
24.00
05 06 07 08 09
Group operating profit £m
IFRS MCEV*
4,000
3,500
1.50
dividend to a sustainable level from which it can grow.
10.0 1.00
5.0 0.50
0
Group adjusted operating profit before tax — We aim to achieve steady
sustainable growth in our
In 2009 MCEV operating profit increased 3% to operating profit, both on
£3,483 million (
2008: 3,367 million
). IFRS operating a MCEV and IFRS basis. In
profit reduced 12% to £2,022 million (
2008:
seeking to achieve this
growth, we continue to
£2,297 million
).
1,996
2,904
2,609
3,251
2,216
3,065
2,297
3,367
2,022
3,483
3,000
adopt strict financial
These results reflect higher long-term and management disciplines
2,500
savings results offset by lower general insurance and underpinned by strong
2,000
corporate governance.
health profits and increased group debt costs.
1,500
1,000
500
0
05 06 07 08 09
Worldwide sales — While our focus is on capital
Worldwide sales £m
efficiency and profit rather
Total worldwide sales decreased by 12% in 2009 than volumes, sales remain
to £45,068 million (
2008: £51,377 million
). an important indicator.
60
Long-term and savings sales decreased 11% Worldwide sales comprise
50
the PVNBP of long-term
to £35,875 million (
2008: £40,240 million
) mainly
0
10
20
40
30
35,894
42,967
50,274
51,377
45,068
savings new business sales
reflecting the tough economic climate. General and net written premiums
insurance and health sales of £9,193 million
(2008:
from the general insurance
and health businesses.
£11,137 million)
were down 17% reflecting the
focus on writing for profit rather than volume.
05 06 07 08 09
* On a MCEV basis from 2007. Prior years presented on an EEV basis
3.50
0