Aviva 2009 Annual Report Download - page 4
Download and view the complete annual report
Please find page 4 of the 2009 Aviva annual report below. You can navigate through the pages in the report by either clicking on the pages listed below, or by using the keyword search tool below to find specific information within the annual report.-
 1
1 -
 2
2 -
 3
3 -
 4
4 -
 5
5 -
 6
6 -
 7
7 -
 8
8 -
 9
9 -
 10
10 -
 11
11 -
 12
12 -
 13
13 -
 14
14 -
 15
15 -
16
-
17
-
18
-
19
-
20
-
21
-
22
-
23
-
24
-
25
-
26
-
27
-
28
-
29
-
30
-
31
-
32
-
33
-
34
-
35
-
36
-
37
-
38
-
39
-
40
-
41
-
42
-
43
-
44
-
45
-
46
-
47
-
48
-
49
-
50
-
51
-
52
-
53
-
54
-
55
-
56
-
57
-
58
-
59
-
60
-
61
-
62
-
63
-
64
-
65
-
66
-
67
-
68
-
69
-
70
-
71
-
72
-
73
-
74
-
75
-
76
-
77
-
78
-
79
-
80
-
81
-
82
-
83
-
84
-
85
-
86
-
87
-
88
-
89
-
90
-
91
-
92
-
93
-
94
-
95
-
96
-
97
-
98
-
99
-
100
-
101
-
102
-
103
-
104
-
105
-
106
-
107
-
108
-
109
-
110
-
111
-
112
-
113
-
114
-
115
-
116
-
117
-
118
-
119
-
120
-
121
-
122
-
123
-
124
-
125
-
126
-
127
-
128
-
129
-
130
-
131
-
132
-
133
-
134
-
135
-
136
-
137
-
138
-
139
-
140
-
141
-
142
-
143
-
144
-
145
-
146
-
147
-
148
-
149
-
150
-
151
-
152
-
153
-
154
-
155
-
156
-
157
-
158
-
159
-
160
-
161
-
162
-
163
-
164
-
165
-
166
-
167
-
168
-
169
-
170
-
171
-
172
-
173
-
174
-
175
-
176
-
177
-
178
-
179
-
180
-
181
-
182
-
183
-
184
-
185
-
186
-
187
-
188
-
189
-
190
-
191
-
192
-
193
-
194
-
195
-
196
-
197
-
198
-
199
-
200
-
201
-
202
-
203
-
204
-
205
-
206
-
207
-
208
-
209
-
210
-
211
-
212
-
213
-
214
-
215
-
216
-
217
-
218
-
219
-
220
-
221
-
222
-
223
-
224
-
225
-
226
-
227
-
228
-
229
-
230
-
231
-
232
-
233
-
234
-
235
-
236
-
237
-
238
-
239
-
240
-
241
-
242
-
243
-
244
-
245
-
246
-
247
-
248
-
249
-
250
-
251
-
252
-
253
-
254
-
255
-
256
-
257
-
258
-
259
-
260
-
261
-
262
-
263
-
264
-
265
-
266
-
267
-
268
-
269
-
270
-
271
-
272
-
273
-
274
-
275
-
276
-
277
-
278
-
279
-
280
-
281
-
282
-
283
-
284
-
285
-
286
-
287
-
288
-
289
-
290
-
291
-
292
-
293
-
294
-
295
-
296
-
297
-
298
-
299
-
300
-
301
-
302
-
303
-
304
-
305
-
306
-
307
-
308
-
309
-
310
-
311
-
312
-
313
-
314
-
315
-
316
-
317
-
318
-
319
-
320
-
321
-
322
-
323
-
324
-
325
-
326
-
327
-
328
 |
 |

02
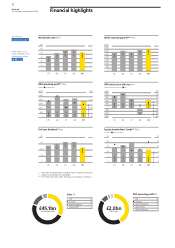
Aviva plc Financial highlights
Annual Report and Accounts 2009
Visit Aviva at
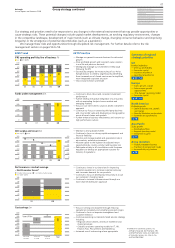
Worldwide sales* £m
MCEV operating profit*** £m
www.aviva.com
60
4,000
3,500
50
0
500
1,500
1,000
3,000
2,500
2,000
2,904
3,251
3,065
3,367
3,483
0
10
20
40
30
35,894
42,967
50,274
51,377
45,068
More detail on our
results available in the
Performance review
l 09 – 66
05 06 07 08 09
05 06 07 08 09
IFRS operating profit** £m
IFRS total return after tax £m
IFRS Dividend cover
IFRS total return after tax EPS
3,000 2.50
2,500 100
2,000 80
2,500
1.00
1.50
Dividend cover (times)
1,996
2,609
2,216
2,297
2,022
1,500 60
2,000 2.00
(885)
1,498
1,315
1,898
2,389
1,000
15
14,899
17,436
20,139
13,162
13,035
Earnings per share (pence)
Return on equity %
1,500
500
0
1,000
(500) (20)
500
(1,000) (40)
0
(1,500) (60)
05 06 07 08 09
05 06 07 08 09
Full year dividend Pence
Equity shareholders’ funds*** £m
MCEV Return on equity
40
25 20
20 16
0
10
20
30
27.27
30.00
33.00
33.00
24.00
10
5
0
05 06 07 08 09
05 06 07 08 09
* From continuing operations including share of associates’ premiums
** Before tax attributable to shareholders
*** On a MCEV basis from 2007. Prior years presented on an EEV basis
£45.1bn
Worldwide sales
IFRS operating profit %
Sales %
UK 42
Europe 48
UK 32
£2.0bn
IFRS basis
Europe 43
North America 14
North America 8
Asia Pacific
Asia Pacific 6
Aviva Investors
12
0
8
4
40
20
0
3
4