Albertsons 2015 Annual Report Download - page 97
Download and view the complete annual report
Please find page 97 of the 2015 Albertsons annual report below. You can navigate through the pages in the report by either clicking on the pages listed below, or by using the keyword search tool below to find specific information within the annual report.-
 1
1 -
2
-
3
-
4
-
5
-
6
-
7
-
8
-
9
-
10
-
11
-
12
-
13
-
14
-
15
-
16
-
17
-
18
-
19
-
20
-
21
-
22
-
23
-
24
-
25
-
26
-
27
-
28
-
29
-
30
-
31
-
32
-
33
-
34
-
35
-
36
-
37
-
38
-
39
-
40
-
41
-
42
-
43
-
44
-
45
-
46
-
47
-
48
-
49
-
50
-
51
-
52
-
53
-
54
-
55
-
56
-
57
-
58
-
59
-
60
-
61
-
62
-
63
-
64
-
65
-
66
-
67
-
68
-
69
-
70
-
71
-
72
-
73
-
74
-
75
-
76
-
77
-
78
-
79
-
80
-
81
-
82
-
83
-
84
-
85
-
86
-
 87
87 -
 88
88 -
 89
89 -
 90
90 -
 91
91 -
 92
92 -
 93
93 -
 94
94 -
 95
95 -
 96
96 -
 97
97 -
 98
98 -
 99
99 -
 100
100 -
 101
101 -
 102
102 -
 103
103 -
 104
104 -
 105
105 -
 106
106 -
 107
107 -
108
-
109
-
110
-
111
-
112
-
113
-
114
-
115
-
116
-
117
-
118
-
119
-
120
 |
 |
95
The Company offers a wide variety of grocery products, general merchandise and health and beauty care, pharmacy, fuel and
other items and services. The Company’s business is classified by management into three reportable segments: Independent
Business, Save-A-Lot and Retail Food. These reportable segments are three distinct businesses, each with a different customer
base, marketing strategy and management structure. The Company reviews its reportable segments on an annual basis, or more
frequently if events or circumstances indicate a change in reportable segments has occurred.
The Independent Business reportable segment derives revenues from wholesale distribution to independently owned retail food
stores and other customers (collectively referred to as “independent retail customers”). The Save-A-Lot reportable segment
derives revenues from the sale of groceries at retail locations operated and licensed by the Company (both the Company’s own
stores and stores licensed by the Company to which the Company distributes wholesale products). The Retail Food reportable
segment derives revenues from the sale of groceries and other products at retail locations operated by the Company.
Substantially all of the Company’s operations are domestic.
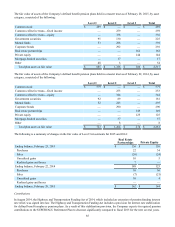
The Company offers a wide variety of nationally advertised brand name and private-label products, primarily including grocery
(both perishable and nonperishable), general merchandise and health and beauty care, pharmacy and fuel, which are sold
through the Company’s owned, licensed and franchised retail stores to shoppers and through its Independent Business to
independent retail customers. The amounts and percentages of Net sales for each group of similar products sold in the
Independent Business, Save-A-Lot and Retail Food segments and Corporate revenue consisted of the following:
2015 2014 2013
Independent Business:
Nonperishable grocery products(1) $ 5,939 33% $ 6,000 35% $ 6,140 36%
Perishable grocery products(2) 2,099 12 1,951 11 1,935 11
Services to independent retail customers and other 96 1 85 1 91 1
8,134 46% 8,036 47% 8,166 48%
Save-A-Lot:
Nonperishable grocery products(1) $ 2,986 17% $ 2,829 17% $ 2,865 17%
Perishable grocery products(2) 1,627 9 1,399 8 1,330 8
4,613 26% 4,228 25% 4,195 25%
Retail Food:
Nonperishable grocery products(1) $ 2,677 15% $ 2,600 15% $ 2,689 16%
Perishable grocery products(2) 1,574 9 1,463 9 1,428 8
Pharmacy products 510 3 491 3 512 3
Fuel 83 — 67 — 77 —
Other 35 — 28 — 27 —
4,879 27% 4,649 27% 4,733 28%
Corporate:
Transition services revenue $ 194 1% $ 240 1% $ 42 —%
Net sales $ 17,820 100% $ 17,153 100% $ 17,136 100%
(1) Includes such items as dry goods, general merchandise, health and beauty care, beverages, dairy, frozen foods, and candy
(2) Includes such items as meat, produce, deli and bakery
NOTE 16—DISCONTINUED OPERATIONS
NAI Banner Sale
On March 21, 2013, the Company sold NAI to AB Acquisition, which resulted in the sale of the NAI banners, including
Albertsons, Acme, Jewel-Osco, Shaw’s and Star Market and related Osco and Sav-on in-store pharmacies (collectively, the
“NAI Banners”).
The Company received net proceeds of approximately $100 and a short-term note receivable of approximately $44 for the
stock of NAI. AB Acquisition assumed approximately $3,200 of debt and capital leases, excluding original issue discounts. In
addition, AB Acquisition assumed the underfunded status of NAI’s related share of the multiemployer pension plans to which
the Company contributed. AB Acquisition’s portion of the underfunded status of the multiemployer pension plans was
estimated to be approximately $1,138 before tax, based on the Company’s estimated “proportionate share” of underfunding
calculated as of February 23, 2013.