Albertsons 2015 Annual Report Download - page 27
Download and view the complete annual report
Please find page 27 of the 2015 Albertsons annual report below. You can navigate through the pages in the report by either clicking on the pages listed below, or by using the keyword search tool below to find specific information within the annual report.-
 1
1 -
2
-
3
-
4
-
5
-
6
-
7
-
8
-
9
-
10
-
11
-
12
-
13
-
14
-
15
-
16
-
 17
17 -
 18
18 -
 19
19 -
 20
20 -
 21
21 -
 22
22 -
 23
23 -
 24
24 -
 25
25 -
 26
26 -
 27
27 -
 28
28 -
 29
29 -
 30
30 -
 31
31 -
 32
32 -
 33
33 -
 34
34 -
 35
35 -
 36
36 -
 37
37 -
38
-
39
-
40
-
41
-
42
-
43
-
44
-
45
-
46
-
47
-
48
-
49
-
50
-
51
-
52
-
53
-
54
-
55
-
56
-
57
-
58
-
59
-
60
-
61
-
62
-
63
-
64
-
65
-
66
-
67
-
68
-
69
-
70
-
71
-
72
-
73
-
74
-
75
-
76
-
77
-
78
-
79
-
80
-
81
-
82
-
83
-
84
-
85
-
86
-
87
-
88
-
89
-
90
-
91
-
92
-
93
-
94
-
95
-
96
-
97
-
98
-
99
-
100
-
101
-
102
-
103
-
104
-
105
-
106
-
107
-
108
-
109
-
110
-
111
-
112
-
113
-
114
-
115
-
116
-
117
-
118
-
119
-
120
 |
 |

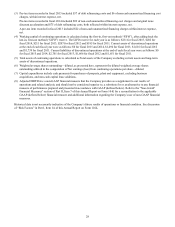
25
COMPARISON OF CUMULATIVE TOTAL SHAREHOLDER RETURN AMONG
SUPERVALU, S&P MidCap 400 AND PEER GROUP(1)
February 27, 2010 through February 28, 2015(2)
Date SUPERVALU
S&P Midcap
400
2015
Peer Group(3) 2014
Peer Group(4)
(in dollars)
February 26, 2010 $ 100.00 $ 100.00 $ 100.00 $ 100.00
February 25, 2011 $ 58.01 $ 132.43 $ 99.16 $ 98.90
February 24, 2012 $ 46.57 $ 137.22 $ 112.48 $ 111.99
February 22, 2013 $ 27.84 $ 156.06 $ 135.78 $ 135.53
February 21, 2014 $ 44.11 $ 194.64 $ 142.82 $ 151.20
February 27, 2015 $ 71.45 $ 219.43 $ 172.07 $ 183.88
(1) Total return assuming $100 invested on February 26, 2010 and reinvestment of dividends on the day they were paid.
(2) The Company’s fiscal year ends on the last Saturday in February.
(3) In fiscal 2015, the Company revised its peer group to better reflect companies with which it more directly competes. The
fiscal 2015 peer group consists of Spartan Stores Inc., Wal-Mart Stores, Inc., Target Corporation, Sysco Corporation, The
Fresh Market, Inc., Delhaize Group SA and Roundy's, Inc.
(4) The Company’s 2014 peer group consisted of Delhaize Group SA, Koninklijke Ahold NV, The Kroger Co., Safeway Inc.
and Wal-Mart Stores, Inc.
The performance graph above is being furnished solely to accompany this Annual Report on Form 10-K pursuant to Item 201
(e) of Regulation S-K, is not being filed for purposes of Section 18 of the Exchange Act and shall not be deemed soliciting