Albertsons 2015 Annual Report Download - page 30
Download and view the complete annual report
Please find page 30 of the 2015 Albertsons annual report below. You can navigate through the pages in the report by either clicking on the pages listed below, or by using the keyword search tool below to find specific information within the annual report.28
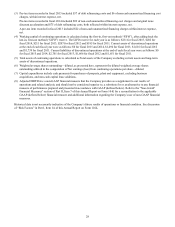
(3) Pre-tax items recorded in fiscal 2015 included $37 of debt refinancing costs and $6 of non-cash unamortized financing cost
charges, within interest expense, net.
Pre-tax items recorded in fiscal 2014 included $99 of non-cash unamortized financing cost charges and original issue
discount acceleration and $75 of debt refinancing costs, both reflected within interest expense, net.
A pre-tax item recorded in fiscal 2013 included $22 of non-cash unamortized financing charges within interest expense,
net.
(4) Working capital of continuing operations is calculated using the first-in, first-out method (“FIFO”), after adding back the
last-in, first-out method (“LIFO”) reserve. The LIFO reserve for each year is as follows: $211 for fiscal 2015, $202 for
fiscal 2014, $211 for fiscal 2013, $207 for fiscal 2012 and $185 for fiscal 2011. Current assets of discontinued operations
at the end of each fiscal year were as follows: $0 for fiscal 2015 and 2014, $1,494 for fiscal 2013, $1,616 for fiscal 2012
and $1,739 for fiscal 2011. Current liabilities of discontinued operations at the end of each fiscal year were as follows: $0
for fiscal 2015 and 2014, $2,701 for fiscal 2013, $1,606 for fiscal 2012 and $1,651 for fiscal 2011.
(5) Total assets of continuing operations is calculated as Total assets of the Company excluding current assets and long-term
assets of discontinued operations.
(6) Weighted average shares outstanding—diluted, as presented here, represents the diluted weighted average shares
outstanding utilized in the computation of Net earnings (loss) from continuing operations per share—diluted.
(7) Capital expenditures include cash payments for purchases of property, plant and equipment, excluding business
acquisitions, and non-cash capital lease additions.
(8) Adjusted EBITDA is a non-GAAP financial measure that the Company provides as a supplement to our results of
operations and related analysis, and should not be considered superior to, a substitute for or an alternative to any financial
measure of performance prepared and presented in accordance with GAAP (defined below). Refer to the “Non-GAAP
Financial Measures” section of Part II, Item 7 of this Annual Report on Form 10-K for a reconciliation to the applicable
GAAP (defined below) financial measure and additional information regarding the Company’s use of non-GAAP financial
measures.
Historical data is not necessarily indicative of the Company’s future results of operations or financial condition. See discussion
of “Risk Factors” in Part I, Item 1A of this Annual Report on Form 10-K.


