Albertsons 2015 Annual Report Download - page 91
Download and view the complete annual report
Please find page 91 of the 2015 Albertsons annual report below. You can navigate through the pages in the report by either clicking on the pages listed below, or by using the keyword search tool below to find specific information within the annual report.-
 1
1 -
2
-
3
-
4
-
5
-
6
-
7
-
8
-
9
-
10
-
11
-
12
-
13
-
14
-
15
-
16
-
17
-
18
-
19
-
20
-
21
-
22
-
23
-
24
-
25
-
26
-
27
-
28
-
29
-
30
-
31
-
32
-
33
-
34
-
35
-
36
-
37
-
38
-
39
-
40
-
41
-
42
-
43
-
44
-
45
-
46
-
47
-
48
-
49
-
50
-
51
-
52
-
53
-
54
-
55
-
56
-
57
-
58
-
59
-
60
-
61
-
62
-
63
-
64
-
65
-
66
-
67
-
68
-
69
-
70
-
71
-
72
-
73
-
74
-
75
-
76
-
77
-
78
-
79
-
80
-
 81
81 -
 82
82 -
 83
83 -
 84
84 -
 85
85 -
 86
86 -
 87
87 -
 88
88 -
 89
89 -
 90
90 -
 91
91 -
 92
92 -
 93
93 -
 94
94 -
 95
95 -
 96
96 -
 97
97 -
 98
98 -
 99
99 -
 100
100 -
 101
101 -
102
-
103
-
104
-
105
-
106
-
107
-
108
-
109
-
110
-
111
-
112
-
113
-
114
-
115
-
116
-
117
-
118
-
119
-
120
 |
 |

89
Multiemployer Postretirement Benefit Plans Other than Pensions
The Company also makes contributions to multiemployer health and welfare plans in amounts set forth in the related collective
bargaining agreements. These plans provide medical, dental, pharmacy, vision and other ancillary benefits to active employees
and retirees as determined by the trustees of each plan. The vast majority of the Company’s contributions benefit active
employees and as such, may not constitute contributions to a postretirement benefit plan. However, the Company is unable to
separate contribution amounts to postretirement benefit plans from contribution amounts paid to benefit active employees.
The Company contributed $89, $87 and $90 for fiscal 2015, 2014 and 2013, respectively, to multiemployer health and welfare
plans. If healthcare provisions within these plans cannot be renegotiated in a manner that reduces the prospective healthcare
cost as the Company intends, the Company’s Selling and administrative expenses could increase in the future.
Collective Bargaining Agreements
As of February 28, 2015, the Company had approximately 38,500 employees. Approximately 16,000 employees are covered by
49 collective bargaining agreements. During fiscal 2015, 19 collective bargaining agreements covering 11,700 employees were
renegotiated and four collective bargaining agreements covering approximately 800 employees expired without their terms
being renegotiated. Negotiations are expected to continue with the bargaining units representing the employees subject to those
agreements. During fiscal 2016, eight collective bargaining agreements covering approximately 1,200 employees are scheduled
to expire.
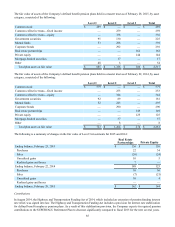
NOTE 12—NET EARNINGS (LOSS) PER SHARE
The following table reflects the calculation of basic and diluted net earnings (loss) per share:
2015 2014 2013
Net earnings (loss) from continuing operations $ 127 $ 13 $ (253)
Less net earnings attributable to noncontrolling interests (7)(7)(10)
Net earnings (loss) from continuing operations attributable to
SUPERVALU INC. 120 6 (263)
Income (loss) from discontinued operations, net of tax 72 176 (1,203)
Net earnings (loss) attributable to SUPERVALU INC. $ 192 $ 182 $ (1,466)
Weighted average number of shares outstanding—basic 260 255 212
Dilutive impact of stock-based awards 4 3 —
Weighted average number of shares outstanding—diluted (1) 264 258 212
Basic net earnings (loss) per share attributable to SUPERVALU INC.:
Continuing operations $ 0.46 $ 0.02 $ (1.24)
Discontinued operations $ 0.28 $ 0.69 $ (5.67)
Basic net earnings (loss) per share $ 0.74 $ 0.71 $ (6.91)
Diluted net earnings (loss) per share attributable to SUPERVALU INC.:
Continuing operations (1) $ 0.45 $ 0.02 $ (1.24)
Discontinued operations (1) $ 0.27 $ 0.68 $ (5.67)
Diluted net earnings (loss) per share $ 0.73 $ 0.70 $ (6.91)
(1) Weighted average number of shares outstanding—diluted was equal to Weighted average number of shares outstanding—
basic for the computation of diluted net loss per share amounts for fiscal 2013.
Stock-based awards of 10, 18 and 25 were outstanding during fiscal 2015, 2014 and 2013, respectively, but were excluded from
the calculation of Net earnings (loss) from continuing operations per share—diluted, Net earnings (loss) from discontinued
operations per share—diluted and Net earnings (loss) per share—diluted for the periods because their inclusion would be
antidilutive.