Albertsons 2015 Annual Report Download - page 37
Download and view the complete annual report
Please find page 37 of the 2015 Albertsons annual report below. You can navigate through the pages in the report by either clicking on the pages listed below, or by using the keyword search tool below to find specific information within the annual report.35
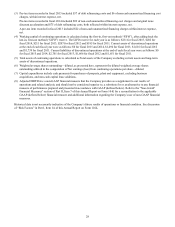
Interest Expense, Net
Interest expense, net for fiscal 2015 was $243, compared with $407 last year. Interest expense, net for fiscal 2015 includes $37 of
debt refinancing costs related to the redemption of $350 of the Company’s 8.00 percent Senior Notes due May 2016 (the “2016
Notes") and costs related to the expense of the Company’s newly issued 7.75 percent Senior Notes due November 2022 (the
“2022 Notes”) outstanding during the 30-day redemption period, and $6 of non-cash unamortized financing cost charges related
to the 2016 Notes redemption and the amendments to the Company’s five-year $1,000 asset-based revolving ABL credit facility
(the “Revolving ABL Credit Facility”). Interest expense, net for last year included $99 of unamortized financing cost charges and
original issue discount acceleration and $75 of debt refinancing costs related to refinancing activities in conjunction with the sale
of NAI and subsequent refinancing activities. When adjusted for these items, the remaining $33 decrease in Interest expense, net
is primarily due to lower average interest rates on lower outstanding debt balances.
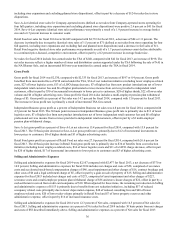
Income Tax Provision
Income tax expense on earnings from continuing operations for fiscal 2015 was $58, or 31.2 percent of earnings from continuing
operations before income taxes, compared with $5, or 30.9 percent last year. The change in the effective tax rate is primarily due
to $22 of discrete tax benefits, primarily related to audit settlements, partnership income and the pension settlement charge, and
$10 of discrete tax expenses related to insignificant discrete tax items recorded in fiscal 2015. The tax rate for fiscal 2014
included certain insignificant discrete tax items that together gave rise to the difference between the combined federal and state
statutory tax rates and the effective tax rate.
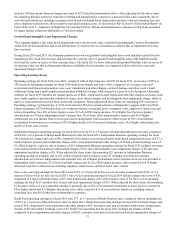
Net Earnings from Continuing Operations
Net earnings from continuing operations for fiscal 2015 were $127, compared with $13 last year. Net earnings from continuing
operations for fiscal 2015 include $70 of after-tax charges and costs related to the non-cash pension settlement charges, debt
refinancing costs, unamortized financing cost charges, store closure charges, a benefit plan charge, net information technology
intrusion costs and severance costs discussed above. Net earnings from continuing operations for last year included $144 of after-
tax net charges and costs primarily related to the debt refinancing activities, severance costs and acceleration of stock-based
compensation charges, asset impairment, contract breakage costs, a legal settlement charge and a multiemployer pension plan
withdrawal charge, offset in part by the gain on sale of property discussed above. When adjusted for these items, the remaining
$40 after-tax increase in Net earnings from continuing operations is primarily due to $25 of lower net periodic pension expense,
$25 of reduced depreciation, amortization expense and occupancy costs, $19 of lower interest expense, $14 of higher earnings
from increased sales, $12 of higher net discrete tax benefits and $7 of lower logistics costs, offset in part by $27 of lower TSA
fees primarily due to the one-year transition fee recognized last year, $20 of incremental investments to lower prices to customers,
higher shrink, stronger private brands pricing support and other margin investments, a $10 higher LIFO charge and $7 of higher
advertising costs.
Income from Discontinued Operations, Net of Tax
Income from discontinued operations, net of tax, for fiscal 2015 was $72, compared with $176 last year. Income from
discontinued operations for fiscal 2015 reflects net tax benefits of $66 primarily related to tangible property repair regulations and
other deduction related changes, property tax refunds and interest income resulting from the settlement of income tax audits.
Discontinued operations results for last year reflected the completion of the sale of NAI on March 21, 2013, net discrete tax
benefits of $105 and a reduction to the loss on sale of NAI of $90, offset in part by severance and other costs of $13.
Comparison of fiscal 2014 ended February 22, 2014 and fiscal 2013 ended February 23, 2013:
Net Sales
Net sales for fiscal 2014 were $17,153, compared with $17,136 for fiscal 2013, an increase of $17. Independent Business net
sales were 46.9 percent of Net sales, Save-A-Lot net sales were 24.6 percent of Net sales, Retail Food net sales were 27.1 percent
of Net sales and Corporate fees earned under the TSA were 1.4 percent of Net sales for fiscal 2014, compared with 47.7 percent,
24.5 percent, 27.6 percent and 0.2 percent, respectively, for fiscal 2013.
Independent Business net sales for fiscal 2014 were $8,036, compared with $8,166 for fiscal 2013, a decrease of $130 or 1.6
percent. The decrease is primarily due to lower sales to existing customers including military and two larger lost accounts, offset
in part by net new business including sales to one NAI banner.
Save-A-Lot net sales for fiscal 2014 were $4,228, compared with $4,195 for fiscal 2013, an increase of $33 or 0.8 percent. The
increase is primarily due to an increase of $148 in sales due to new store openings and positive network identical store sales of
0.2 percent or $9 (defined as net sales from Company-operated stores and sales to licensee stores operating for four full quarters,


