Albertsons 2015 Annual Report Download - page 58
Download and view the complete annual report
Please find page 58 of the 2015 Albertsons annual report below. You can navigate through the pages in the report by either clicking on the pages listed below, or by using the keyword search tool below to find specific information within the annual report.-
 1
1 -
2
-
3
-
4
-
5
-
6
-
7
-
8
-
9
-
10
-
11
-
12
-
13
-
14
-
15
-
16
-
17
-
18
-
19
-
20
-
21
-
22
-
23
-
24
-
25
-
26
-
27
-
28
-
29
-
30
-
31
-
32
-
33
-
34
-
35
-
36
-
37
-
38
-
39
-
40
-
41
-
42
-
43
-
44
-
45
-
46
-
47
-
 48
48 -
 49
49 -
 50
50 -
 51
51 -
 52
52 -
 53
53 -
 54
54 -
 55
55 -
 56
56 -
 57
57 -
 58
58 -
 59
59 -
 60
60 -
 61
61 -
 62
62 -
 63
63 -
 64
64 -
 65
65 -
 66
66 -
 67
67 -
 68
68 -
69
-
70
-
71
-
72
-
73
-
74
-
75
-
76
-
77
-
78
-
79
-
80
-
81
-
82
-
83
-
84
-
85
-
86
-
87
-
88
-
89
-
90
-
91
-
92
-
93
-
94
-
95
-
96
-
97
-
98
-
99
-
100
-
101
-
102
-
103
-
104
-
105
-
106
-
107
-
108
-
109
-
110
-
111
-
112
-
113
-
114
-
115
-
116
-
117
-
118
-
119
-
120
 |
 |

56
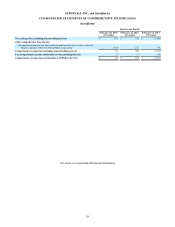
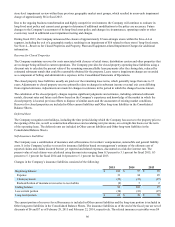
SUPERVALU INC. and Subsidiaries
CONSOLIDATED SEGMENT FINANCIAL INFORMATION
(In millions)
Fiscal Years Ended
February 28, 2015
(53 weeks)
February 22, 2014
(52 weeks)
February 23, 2013
(52 weeks)
Net sales
Independent Business $ 8,134 $ 8,036 $ 8,166
% of total 45.6% 46.9% 47.7 %
Save-A-Lot 4,613 4,228 4,195
% of total 25.9% 24.6% 24.5 %
Retail Food 4,879 4,649 4,733
% of total 27.4% 27.1% 27.6 %
Corporate 194 240 42
% of total 1.1% 1.4% 0.2 %
Total net sales $ 17,820 $ 17,153 $ 17,136
100.0% 100.0% 100.0 %
Operating earnings (loss)
Independent Business $ 243 $ 235 $ 199
% of Independent Business sales 3.0% 2.9% 2.4 %
Save-A-Lot 153 167 143
% of Save-A-Lot sales 3.3% 3.9% 3.4 %
Retail Food 122 77 (153)
% of Retail Food sales 2.5% 1.7% (3.2)%
Corporate (94) (56) (339)
Total operating earnings (loss) 424 423 (150)
% of total net sales 2.4% 2.5% (0.9)%
Interest expense, net 243 407 269
Equity in earnings of unconsolidated affiliates (4) (2) (3)
Earnings (loss) from continuing operations before income taxes 185 18 (416)
Income tax provision (benefit) 58 5 (163)
Net earnings (loss) from continuing operations 127 13 (253)
Income (loss) from discontinued operations, net of tax 72 176 (1,203)
Net earnings (loss) including noncontrolling interests 199 189 (1,456)
Less net earnings attributable to noncontrolling interests (7) (7) (10)
Net earnings (loss) attributable to SUPERVALU INC. $ 192 $ 182 $ (1,466)
Depreciation and amortization
Independent Business $ 48 $ 51 $ 64
Save-A-Lot 65 64 68
Retail Food 172 187 233
Total $ 285 $ 302 $ 365
Capital expenditures
Independent Business $ 70 $ 24 $ 33
Save-A-Lot 97 42 101
Retail Food 73 47 107
Total $ 240 $ 113 $ 241
Identifiable assets
Independent Business $ 2,022 $ 2,007 $ 1,857
Save-A-Lot 1,029 925 936
Retail Food 1,406 1,415 1,695
Corporate 28 27 75
Discontinued operations — — 6,471
Total $ 4,485 $ 4,374 $ 11,034
Refer to Note 15—Segment Information in the accompanying Notes to Consolidated Financial Statements for additional information concerning the
Company’s reportable segments.
See Notes to Consolidated Financial Statements.