Albertsons 2015 Annual Report Download - page 86
Download and view the complete annual report
Please find page 86 of the 2015 Albertsons annual report below. You can navigate through the pages in the report by either clicking on the pages listed below, or by using the keyword search tool below to find specific information within the annual report.-
 1
1 -
2
-
3
-
4
-
5
-
6
-
7
-
8
-
9
-
10
-
11
-
12
-
13
-
14
-
15
-
16
-
17
-
18
-
19
-
20
-
21
-
22
-
23
-
24
-
25
-
26
-
27
-
28
-
29
-
30
-
31
-
32
-
33
-
34
-
35
-
36
-
37
-
38
-
39
-
40
-
41
-
42
-
43
-
44
-
45
-
46
-
47
-
48
-
49
-
50
-
51
-
52
-
53
-
54
-
55
-
56
-
57
-
58
-
59
-
60
-
61
-
62
-
63
-
64
-
65
-
66
-
67
-
68
-
69
-
70
-
71
-
72
-
73
-
74
-
75
-
 76
76 -
 77
77 -
 78
78 -
 79
79 -
 80
80 -
 81
81 -
 82
82 -
 83
83 -
 84
84 -
 85
85 -
 86
86 -
 87
87 -
 88
88 -
 89
89 -
 90
90 -
 91
91 -
 92
92 -
 93
93 -
 94
94 -
 95
95 -
 96
96 -
97
-
98
-
99
-
100
-
101
-
102
-
103
-
104
-
105
-
106
-
107
-
108
-
109
-
110
-
111
-
112
-
113
-
114
-
115
-
116
-
117
-
118
-
119
-
120
 |
 |

84
needed basis. Plan assets are invested using a combination of active and passive investment strategies. Passive, or “indexed”
strategies, attempt to mimic rather than exceed the investment performance of a market benchmark. The plan’s active
investment strategies employ multiple investment management firms. Managers within each asset class cover a range of
investment styles and approaches and are combined in a way that controls for capitalization, and style biases (equities) and
interest rate exposures (fixed income) versus benchmark indices. Monitoring activities to evaluate performance against targets
and measure investment risk take place on an ongoing basis through annual liability measurements, periodic asset/liability
studies and quarterly investment portfolio reviews.
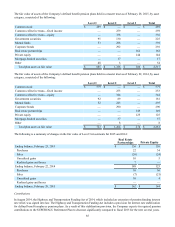
The asset allocation targets and the actual allocation of pension plan assets are as follows:
Asset Category Target 2015 2014
Domestic equity 24.4% 24.8% 30.2%
International equity 11.0% 11.3% 14.1%
Private equity 6.2% 6.2% 5.5%
Fixed income 48.7% 48.1% 41.3%
Real estate 9.7% 9.6% 8.9%
Total 100.0% 100.0% 100.0%
The following is a description of the valuation methodologies used for investments measured at fair value:
Common stock—Valued at the closing price reported in the active market in which the individual securities are traded.
Common collective trusts—Valued at net asset value (“NAV”), which is based on the fair value of the underlying securities
owned by the fund divided by the number of shares outstanding. The NAV unit price is quoted on a private market that is
not active. However, the NAV is based on the fair value of the underlying securities within the fund, which are traded on an
active market, and valued at the closing price reported on the active market on which those individual securities are traded.
Corporate bonds—Valued based on yields currently available on comparable securities of issuers with similar credit
ratings. When quoted prices are not available for identical or similar bonds, the fair value is based upon an industry
valuation model, which maximizes observable inputs.
Government securities—Certain government securities are valued at the closing price reported in the active market in
which the security is traded. Other government securities are valued based on yields currently available on comparable
securities of issuers with similar credit ratings.
Mortgage backed securities—Valued based on yields currently available on comparable securities of issuers with similar
credit ratings. When quoted prices are not available for identical or similar bonds, the fair value is based upon an industry
valuation model, which maximizes observable inputs.
Private equity and real estate partnerships—Valued using the most recent general partner statement of fair value, updated
for any subsequent partnership interests’ cash flows or expected changes in fair value.
Mutual funds—Mutual funds are valued at the closing price reported in the active market in which the individual securities
are traded.
Synthetic guaranteed investment contract—Valued by discounting the related cash flows based on current yields of similar
instruments with comparable durations considering the credit-worthiness of the issuer.
Other—Valued under an approach that maximizes observable inputs, such as gathering consensus data from the market
participant’s best estimate of mid-market pricing for actual trades or positions held.
The valuation methods described above may produce a fair value calculation that may not be indicative of net realizable value
or reflective of future fair values. Furthermore, while the Company believes its valuation methods are appropriate and
consistent with other market participants, the use of different methodologies or assumptions to determine the fair value of
certain financial instruments could result in a different fair value measurement.