3M 2013 Annual Report Download - page 92
Download and view the complete annual report
Please find page 92 of the 2013 3M annual report below. You can navigate through the pages in the report by either clicking on the pages listed below, or by using the keyword search tool below to find specific information within the annual report.-
 1
1 -
2
-
3
-
4
-
5
-
6
-
7
-
8
-
9
-
10
-
11
-
12
-
13
-
14
-
15
-
16
-
17
-
18
-
19
-
20
-
21
-
22
-
23
-
24
-
25
-
26
-
27
-
28
-
29
-
30
-
31
-
32
-
33
-
34
-
35
-
36
-
37
-
38
-
39
-
40
-
41
-
42
-
43
-
44
-
45
-
46
-
47
-
48
-
49
-
50
-
51
-
52
-
53
-
54
-
55
-
56
-
57
-
58
-
59
-
60
-
61
-
62
-
63
-
64
-
65
-
66
-
67
-
68
-
69
-
70
-
71
-
72
-
73
-
74
-
75
-
76
-
77
-
78
-
79
-
80
-
81
-
 82
82 -
 83
83 -
 84
84 -
 85
85 -
 86
86 -
 87
87 -
 88
88 -
 89
89 -
 90
90 -
 91
91 -
 92
92 -
 93
93 -
 94
94 -
 95
95 -
 96
96 -
 97
97 -
 98
98 -
 99
99 -
 100
100 -
 101
101 -
 102
102 -
103
-
104
-
105
-
106
-
107
-
108
-
109
-
110
-
111
-
112
-
113
-
114
-
115
-
116
-
117
-
118
-
119
-
120
-
121
-
122
-
123
-
124
-
125
-
126
-
127
-
128
-
129
-
130
-
131
-
132
 |
 |

86
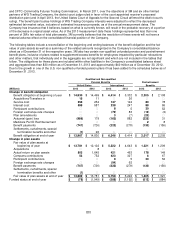
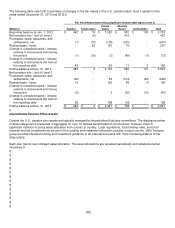
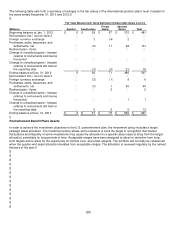
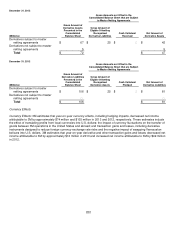
The following table sets forth a summary of changes in the fair values of the international pension plans’ level 3 assets for
the years ended December 31, 2013 and 2012:
Fair Value Measurement Using Significant Unobservable Inputs (Level 3)
Equities
Fixed Income
Private
Equity
Absolute
Return
Total (Millions)
Beginning balance at Jan. 1, 2012
$
5 $ 39
$
67 $ 370
$
481
Net transfers into / (out of) level 3
― ― ― ― ―
Foreign currency exchange
― 2 (4) 2 ―
Purchases, sales, issuances, and
settlements, net
― (2) 11 92 101
Realized gain / (loss)
― ― ― ― ―
Change in unrealized gains / (losses)
relating to instruments sold during
the period
― ― ― ― ―
Change in unrealized gains / (losses)
relating to instruments still held at
the reporting date
― (3) (3) 21 15
Ending balance at Dec. 31, 2012
5 36 71 485 597
Net transfers into / (out of) level 3
― ― ― ― ―
Foreign currency exchange
― (2) (1) 9 6
Purchases, sales, issuances, and
settlements, net
― (2) 1 50 49
Realized gain / (loss)
― ― 2 ― 2
Change in unrealized gains / (losses)
relating to instruments sold during
the period
― ― ― 1 1
Change in unrealized gains / (losses)
relating to instruments still held at
the reporting date
― 5 2 5 12
Ending balance at Dec. 31, 2013
$
5 $ 37
$
75 $ 550
$
667
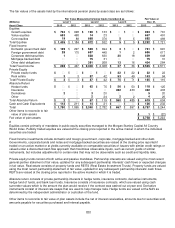
Postretirement Benefit Plans Assets
In order to achieve the investment objectives in the U.S. postretirement plan, the investment policy includes a target
strategic asset allocation. The investment policy allows some tolerance around the target in recognition that market
fluctuations and illiquidity of some investments may cause the allocation to a specific asset class to stray from the target
allocation, potentially for long periods of time. Acceptable ranges have been designed to allow for deviation from long-
term targets and to allow for the opportunity for tactical over- and under-weights. The portfolio will normally be rebalanced
when the quarter-end asset allocation deviates from acceptable ranges. The allocation is reviewed regularly by the named
fiduciary of the plan.