3M 2013 Annual Report Download - page 34
Download and view the complete annual report
Please find page 34 of the 2013 3M annual report below. You can navigate through the pages in the report by either clicking on the pages listed below, or by using the keyword search tool below to find specific information within the annual report.-
 1
1 -
2
-
3
-
4
-
5
-
6
-
7
-
8
-
9
-
10
-
11
-
12
-
13
-
14
-
15
-
16
-
17
-
18
-
19
-
20
-
21
-
22
-
23
-
 24
24 -
 25
25 -
 26
26 -
 27
27 -
 28
28 -
 29
29 -
 30
30 -
 31
31 -
 32
32 -
 33
33 -
 34
34 -
 35
35 -
 36
36 -
 37
37 -
 38
38 -
 39
39 -
 40
40 -
 41
41 -
 42
42 -
 43
43 -
 44
44 -
45
-
46
-
47
-
48
-
49
-
50
-
51
-
52
-
53
-
54
-
55
-
56
-
57
-
58
-
59
-
60
-
61
-
62
-
63
-
64
-
65
-
66
-
67
-
68
-
69
-
70
-
71
-
72
-
73
-
74
-
75
-
76
-
77
-
78
-
79
-
80
-
81
-
82
-
83
-
84
-
85
-
86
-
87
-
88
-
89
-
90
-
91
-
92
-
93
-
94
-
95
-
96
-
97
-
98
-
99
-
100
-
101
-
102
-
103
-
104
-
105
-
106
-
107
-
108
-
109
-
110
-
111
-
112
-
113
-
114
-
115
-
116
-
117
-
118
-
119
-
120
-
121
-
122
-
123
-
124
-
125
-
126
-
127
-
128
-
129
-
130
-
131
-
132
 |
 |

28
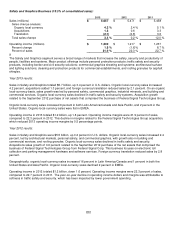
Operating income decreased 10.0 percent to $1.0 billion in 2012. Operating income margins were 18.8 percent, compared
to 19.9 percent in 2011. The year-on-year decline was largely attributable to the decline in optical systems.
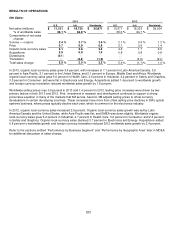
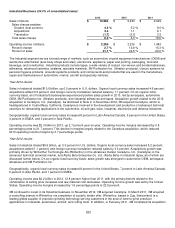
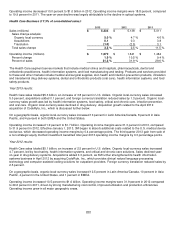
Health Care Business (17.3% of consolidated sales):
2013 2012 2011
Sales (millions)
$
5,334
$
5,138
$
5,011
Sales change analysis:
Organic local currency
5.0
%
4.7
%
4.6
%
Acquisitions
0.1
0.3
3.8
Translation
(1.3)
(2.5)
3.1
Total sales change
3.8
%
2.5
%
11.5
%
Operating income (millions)
$
1,672
$
1,641
$
1,484
Percent change
1.9
%
10.5
%
9.4
%
Percent of sales
31.3
%
31.9
%
29.6
%
The Health Care segment serves markets that include medical clinics and hospitals, pharmaceuticals, dental and
orthodontic practitioners, health information systems, and food manufacturing and testing. Products and services provided
to these and other markets include medical and surgical supplies, skin health and infection prevention products, inhalation
and transdermal drug delivery systems, dental and orthodontic products (oral care), health information systems, and food
safety products.
Year 2013 results:
Health Care sales totaled $5.3 billion, an increase of 3.8 percent in U.S. dollars. Organic local-currency sales increased
5.0 percent, acquisitions added 0.1 percent, and foreign currency translation reduced sales by 1.3 percent. Organic local-
currency sales growth was led by health information systems, food safety, critical and chronic care, infection prevention,
and oral care. Organic local-currency sales declined in drug delivery. Acquisition growth related to the April 2012
acquisition of CodeRyte, Inc., which is discussed further below.
On a geographic basis, organic local-currency sales increased 10 percent in Latin America/Canada, 8 percent in Asia
Pacific, and 4 percent in both EMEA and the United States.
Operating income increased 1.9 percent to $1.7 billion. Operating income margins were 31.3 percent in 2013, compared
to 31.9 percent in 2012. Effective January 1, 2013, 3M began to absorb additional costs related to the U.S. medical device
excise tax, which decreased operating income margins by 0.4 percentage points. The third-quarter 2013 gain from sale of
a non-strategic equity method investment benefited total year 2013 operating income margins by 0.3 percentage points.
Year 2012 results:
Health Care sales totaled $5.1 billion, an increase of 2.5 percent in U.S. dollars. Organic local-currency sales increased
4.7 percent, led by food safety, health information systems, and critical and chronic care solutions. Sales declined year-
on-year in drug delivery systems. Acquisitions added 0.3 percent, as 3M further strengthened its health information
systems business in April 2012 by acquiring CodeRyte, Inc., which provides clinical natural language processing
technology and computer-assisted coding solutions for outpatient providers. Foreign currency translation reduced sales by
2.5 percent.
On a geographic basis, organic local-currency sales increased 12.5 percent in Latin America/Canada, 10 percent in Asia
Pacific, 4 percent in the United States, and 1 percent in EMEA.
Operating income increased 10.5 percent to $1.6 billion. Operating income margins were 31.9 percent in 2012 compared
to 29.6 percent in 2011, driven by strong manufacturing cost control, improved utilization and production efficiencies.
Operating income grew in all major geographic areas.