3M 2013 Annual Report Download - page 86
Download and view the complete annual report
Please find page 86 of the 2013 3M annual report below. You can navigate through the pages in the report by either clicking on the pages listed below, or by using the keyword search tool below to find specific information within the annual report.-
 1
1 -
2
-
3
-
4
-
5
-
6
-
7
-
8
-
9
-
10
-
11
-
12
-
13
-
14
-
15
-
16
-
17
-
18
-
19
-
20
-
21
-
22
-
23
-
24
-
25
-
26
-
27
-
28
-
29
-
30
-
31
-
32
-
33
-
34
-
35
-
36
-
37
-
38
-
39
-
40
-
41
-
42
-
43
-
44
-
45
-
46
-
47
-
48
-
49
-
50
-
51
-
52
-
53
-
54
-
55
-
56
-
57
-
58
-
59
-
60
-
61
-
62
-
63
-
64
-
65
-
66
-
67
-
68
-
69
-
70
-
71
-
72
-
73
-
74
-
75
-
 76
76 -
 77
77 -
 78
78 -
 79
79 -
 80
80 -
 81
81 -
 82
82 -
 83
83 -
 84
84 -
 85
85 -
 86
86 -
 87
87 -
 88
88 -
 89
89 -
 90
90 -
 91
91 -
 92
92 -
 93
93 -
 94
94 -
 95
95 -
 96
96 -
97
-
98
-
99
-
100
-
101
-
102
-
103
-
104
-
105
-
106
-
107
-
108
-
109
-
110
-
111
-
112
-
113
-
114
-
115
-
116
-
117
-
118
-
119
-
120
-
121
-
122
-
123
-
124
-
125
-
126
-
127
-
128
-
129
-
130
-
131
-
132
 |
 |

80
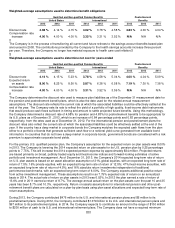
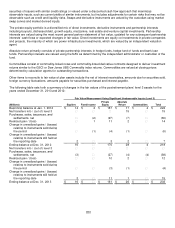
Weighted
-
average assumptions used to determine benefit obligations
Qualified and Non-qualified Pension Benefits
Postretirement
United States
International
Benefits
2013
2012
2011
2013
2012
2011
2013
2012
2011
Discount rate
4.98
%
4.14 %
4.15
%
4.02
%
3.78
%
4.58
%
4.83
%
4.00
%
4.04 %
Compensation rate
increase
4.00
%
4.00 %
4.00
%
3.35
%
3.31
%
3.52
%
N/A
N/A
N/A
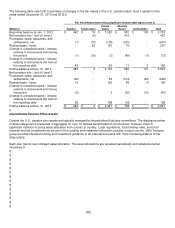
The Company is in the process of transitioning all current and future retirees to the savings account benefits-based plan
announced in 2008. The contributions provided by the Company to the health savings accounts increase three percent
per year. Therefore, the Company no longer has material exposure to health care cost inflation.
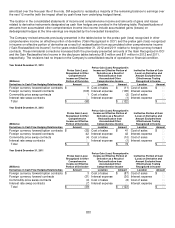
Weighted
-
average assumptions used to determine net cost for years ended
Qualified and Non-qualified Pension Benefits
Postretirement
United States
International
Benefits
2013
2012
2011
2013
2012
2011
2013
2012
2011
Discount rate
4.14
%
4.15 %
5.23
%
3.78
%
4.58
%
5.04
%
4.00
%
4.04
%
5.09 %
Expected return
on assets
8.00
%
8.25 %
8.50
%
5.87
%
6.38
%
6.58
%
7.19
%
7.30
%
7.38 %
Compensation rate
increase
4.00
%
4.00 %
4.00
%
3.31
%
3.52
%
3.59
%
N/A
N/A
N/A
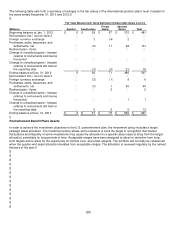
The Company determines the discount rate used to measure plan liabilities as of the December 31 measurement date for
the pension and postretirement benefit plans, which is also the date used for the related annual measurement
assumptions. The discount rate reflects the current rate at which the associated liabilities could be effectively settled at the
end of the year. The Company sets its rate to reflect the yield of a portfolio of high quality, fixed-income debt instruments
that would produce cash flows sufficient in timing and amount to settle projected future benefits. Using this methodology,
the Company determined a discount rate of 4.98% for pension and 4.83% for postretirement benefits to be appropriate for
its U.S. plans as of December 31, 2013, which is an increase of 0.84 percentage points and 0.83 percentage points,
respectively, from the rates used as of December 31, 2012. For the international pension and postretirement plans the
discount rates also reflect the current rate at which the associated liabilities could be effectively settled at the end of the
year. If the country has a deep market in corporate bonds the Company matches the expected cash flows from the plan
either to a portfolio of bonds that generate sufficient cash flow or a notional yield curve generated from available bond
information. In countries that do not have a deep market in corporate bonds, government bonds are considered with a risk
premium to approximate corporate bond yields.
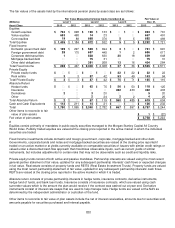
For the primary U.S. qualified pension plan, the Company’s assumption for the expected return on plan assets was 8.00%
in 2013. The Company is lowering the 2014 expected return on plan assets for its U.S. pension plan by 0.25 percentage
points to 7.75%. This will increase the 2014 expected pension expense by approximately $34 million. Projected returns
are based primarily on broad, publicly traded equity and fixed-income indices and forward-looking estimates of active
portfolio and investment management. As of December 31, 2013, the Company’s 2014 expected long-term rate of return
on U.S. plan assets is based on an asset allocation assumption of 21% global equities, with an expected long-term rate of
return of 7.5%; 16% private equities, with an expected long-term rate of return of 12.5%; 47% fixed-income securities, with
an expected long-term rate of return of 4.5%; and 16% absolute return investments independent of traditional
performance benchmarks, with an expected long term return of 6.00%. The Company expects additional positive return
from active investment management. These assumptions result in an 7.75% expected rate of return on an annualized
basis in 2014. The actual rate of return on plan assets in 2013 was 6.02%. In 2012 the plan earned a rate of return of
13.6% and in 2011 earned a return of 8.7%. The average annual actual return on the plan assets over the past 10 and 25
years has been 8.7% and 10.3%, respectively. Return on assets assumptions for international pension and other post-
retirement benefit plans are calculated on a plan-by-plan basis using plan asset allocations and expected long-term rate of
return assumptions.
During 2013, the Company contributed $476 million to its U.S. and international pension plans and $6 million to its
postretirement plans. During 2012, the Company contributed $1.079 billion to its U.S. and international pension plans and
$67 million to its postretirement plans. In 2014, the Company expects to contribute an amount in the range of $100 million
to $200 million of cash to its U.S. and international retirement plans. The Company does not have a required minimum