3M 2013 Annual Report Download - page 27
Download and view the complete annual report
Please find page 27 of the 2013 3M annual report below. You can navigate through the pages in the report by either clicking on the pages listed below, or by using the keyword search tool below to find specific information within the annual report.-
 1
1 -
2
-
3
-
4
-
5
-
6
-
7
-
8
-
9
-
10
-
11
-
12
-
13
-
14
-
15
-
16
-
 17
17 -
 18
18 -
 19
19 -
 20
20 -
 21
21 -
 22
22 -
 23
23 -
 24
24 -
 25
25 -
 26
26 -
 27
27 -
 28
28 -
 29
29 -
 30
30 -
 31
31 -
 32
32 -
 33
33 -
 34
34 -
 35
35 -
 36
36 -
 37
37 -
38
-
39
-
40
-
41
-
42
-
43
-
44
-
45
-
46
-
47
-
48
-
49
-
50
-
51
-
52
-
53
-
54
-
55
-
56
-
57
-
58
-
59
-
60
-
61
-
62
-
63
-
64
-
65
-
66
-
67
-
68
-
69
-
70
-
71
-
72
-
73
-
74
-
75
-
76
-
77
-
78
-
79
-
80
-
81
-
82
-
83
-
84
-
85
-
86
-
87
-
88
-
89
-
90
-
91
-
92
-
93
-
94
-
95
-
96
-
97
-
98
-
99
-
100
-
101
-
102
-
103
-
104
-
105
-
106
-
107
-
108
-
109
-
110
-
111
-
112
-
113
-
114
-
115
-
116
-
117
-
118
-
119
-
120
-
121
-
122
-
123
-
124
-
125
-
126
-
127
-
128
-
129
-
130
-
131
-
132
 |
 |

21
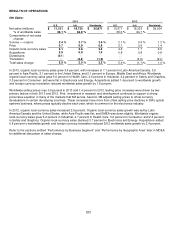
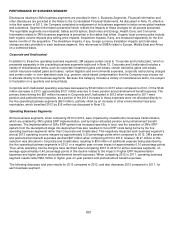
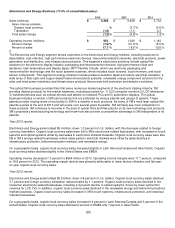
offset by cost-control efforts and savings from 3M’s first-quarter 2012 voluntary early retirement incentive program. R&D,
measured as a percent of sales, was 5.6 percent in 2013, compared to 5.5 percent in 2012 and 5.3 percent in 2011.
Operating Income:
3M uses operating income as one of its primary business segment performance measurement tools.
Operating income margins were 21.6 percent in 2013, compared to 21.7 in 2012, a decrease of 0.1 percentage points.
Items that reduced operating income margins included a 0.5 percentage point impact from lower factory
utilization/productivity, along with a 0.4 percentage point impact from the combination of business transformation, enabled
by 3M’s global ERP implementation, along with more R&D aimed at disruptive innovation. The recently enacted medical
device excise tax in the U.S., foreign currency effects, acquisition impacts, and other net impacts reduced operating
income margins by 0.7 percentage points. These factors were largely offset by items that increased operating income
margins, which included a 1.2 percentage point benefit from the combination of selling price increases and raw material
cost decreases. Finally, lower pension/postretirement benefit costs increased operating income margins by 0.3
percentage points.
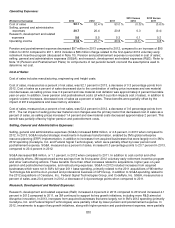
Operating income was 21.7 percent of sales in 2012, compared to 20.9 percent of sales in 2011, an improvement of 0.8
percentage points. The improvement was driven by a 1.6 percentage point benefit from the combination of selling price
increases and raw material cost decreases. This was partially offset by increased pension/postretirement benefit costs
and acquisition impacts, each of which reduced margins by 0.3 percentage points, and other net impacts, which
decreased margins by 0.2 percentage points.
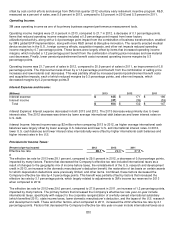
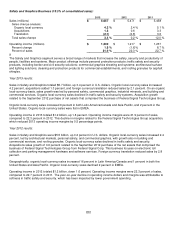
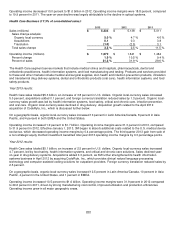
Interest Expense and Income:
(Millions)
2013
2012
2011
Interest expense
$
145
$
171 $
186
Interest income
(41)
(39)
(39)
Total
$
104
$
132 $
147
Interest Expense: Interest expense decreased in both 2013 and 2012. The 2013 decrease was primarily due to lower
interest rates. The 2012 decrease was driven by lower average international debt balances and lower interest rates on
U.S. debt.
Interest Income: Interest income was up $2 million when comparing 2013 to 2012, as higher average international cash
balances were largely offset by lower average U.S. balances and lower U.S. and international interest rates. In 2012,
lower U.S. cash balances and lower interest rates internationally were offset by higher international cash balances and
higher interest rates in the U.S.
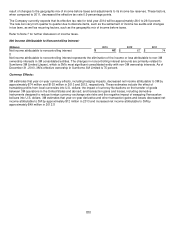
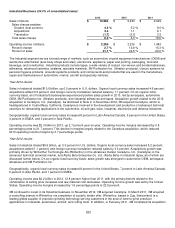
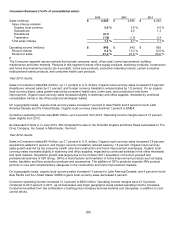
Provision for Income Taxes:
(Percent of pre-tax income)
2013 2012 2011
Effective tax rate
28.1
%
29.0
%
27.8
%
The effective tax rate for 2013 was 28.1 percent, compared to 29.0 percent in 2012, a decrease of 0.9 percentage points,
impacted by many factors. Factors that decreased the Company’s effective tax rate included international taxes as a
result of changes to the geographic mix of income before taxes, the reinstatement of the U.S. research and development
credit in 2013, an increase in the domestic manufacturer’s deduction benefit, the restoration of tax basis on certain assets
for which depreciation deductions were previously limited, and other items. Combined, these factors decreased the
Company’s effective tax rate by 4.0 percentage points. This benefit was partially offset by factors that increased the
effective tax rate by 3.1 percentage points, which largely related to adjustments to 3M’s income tax reserves for 2013
when compared to 2012.
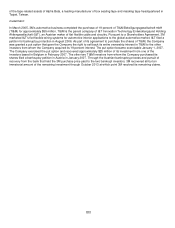
The effective tax rate for 2012 was 29.0 percent, compared to 27.8 percent in 2011, an increase of 1.2 percentage points,
impacted by many factors. The primary factors that increased the Company’s effective tax rate year-on-year include
international taxes, specifically with respect to the corporate reorganization of a wholly owned international subsidiary
(which benefited 2011), state income taxes, lower domestic manufacturer’s deduction, and the lapse of the U.S. research
and development credit. These and other factors, when compared to 2011, increased the 2012 effective tax rate by 2.1
percentage points. Factors that decreased the Company’s effective tax rate year-on-year include international taxes as a