3M 2013 Annual Report Download - page 29
Download and view the complete annual report
Please find page 29 of the 2013 3M annual report below. You can navigate through the pages in the report by either clicking on the pages listed below, or by using the keyword search tool below to find specific information within the annual report.-
 1
1 -
2
-
3
-
4
-
5
-
6
-
7
-
8
-
9
-
10
-
11
-
12
-
13
-
14
-
15
-
16
-
17
-
18
-
 19
19 -
 20
20 -
 21
21 -
 22
22 -
 23
23 -
 24
24 -
 25
25 -
 26
26 -
 27
27 -
 28
28 -
 29
29 -
 30
30 -
 31
31 -
 32
32 -
 33
33 -
 34
34 -
 35
35 -
 36
36 -
 37
37 -
 38
38 -
 39
39 -
40
-
41
-
42
-
43
-
44
-
45
-
46
-
47
-
48
-
49
-
50
-
51
-
52
-
53
-
54
-
55
-
56
-
57
-
58
-
59
-
60
-
61
-
62
-
63
-
64
-
65
-
66
-
67
-
68
-
69
-
70
-
71
-
72
-
73
-
74
-
75
-
76
-
77
-
78
-
79
-
80
-
81
-
82
-
83
-
84
-
85
-
86
-
87
-
88
-
89
-
90
-
91
-
92
-
93
-
94
-
95
-
96
-
97
-
98
-
99
-
100
-
101
-
102
-
103
-
104
-
105
-
106
-
107
-
108
-
109
-
110
-
111
-
112
-
113
-
114
-
115
-
116
-
117
-
118
-
119
-
120
-
121
-
122
-
123
-
124
-
125
-
126
-
127
-
128
-
129
-
130
-
131
-
132
 |
 |

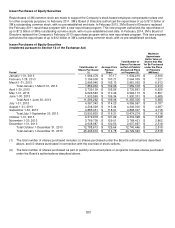
23
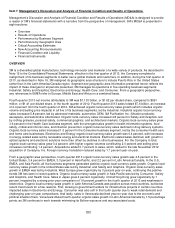
PERFORMANCE BY BUSINESS SEGMENT
Disclosures relating to 3M’s business segments are provided in Item 1, Business Segments. Financial information and
other disclosures are provided in the Notes to the Consolidated Financial Statements. As discussed in Note 15, effective
in the first quarter of 2013, the Company completed a realignment of its business segments to better serve global markets
and customers. Segment information presented herein reflects the impacts of these changes for all periods presented.
The reportable segments are Industrial; Safety and Graphics; Electronics and Energy; Health Care; and Consumer.
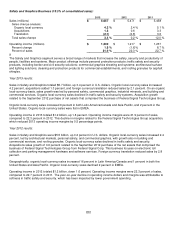
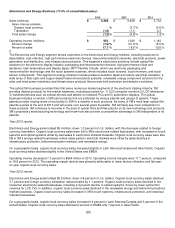
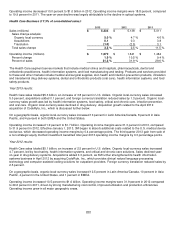
Information related to 3M’s business segments is presented in the tables that follow. Organic local-currency sales include
both organic volume impacts plus selling price impacts. Acquisition impacts, if any, are measured separately for the first
twelve months of the acquisition. The divestiture impacts, if any, foreign currency translation impacts and total sales
change are also provided for each business segment. Any references to EMEA relate to Europe, Middle East and Africa
on a combined basis.
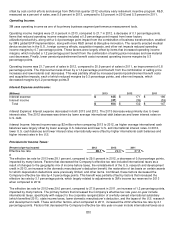
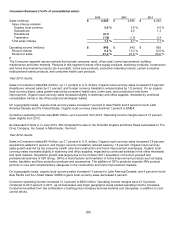
Corporate and Unallocated:
In addition to these five operating business segments, 3M assigns certain costs to “Corporate and Unallocated,” which is
presented separately in the preceding business segments table and in Note 15. Corporate and Unallocated includes a
variety of miscellaneous items, such as corporate investment gains and losses, certain derivative gains and losses,
certain insurance-related gains and losses, certain litigation and environmental expenses, corporate restructuring charges
and certain under- or over-absorbed costs (e.g. pension, stock-based compensation) that the Company may choose not
to allocate directly to its business segments. Because this category includes a variety of miscellaneous items, it is subject
to fluctuation on a quarterly and annual basis.
Corporate and Unallocated operating expenses decreased by $149 million in 2013 when compared to 2012. Of the $149
million decrease in 2013, approximately $127 million was due to lower pension and postretirement benefit expense. The
primary items driving the $51 million increase in Corporate and Unallocated in 2012 when compared to 2011 were
pension and postretirement expense, as a portion of the 2012 increase in these expenses were not allocated directly to
the five operating business segments ($63 million), partially offset by an increase in other environmental insurance
receivables, which benefited 2012 by $15 million (as discussed in Note 13).
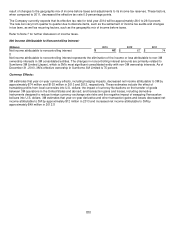
Operating Business Segments:
All five business segments, when comparing 2013 to 2012, were impacted by investments in business transformation,
which are enabled by 3M’s global ERP implementation, and by higher allocated pension and postretirement benefit
expenses. The implementation of 3M’s ERP system has increased spending in total, and the transition of 3M’s ERP
system from the development stage into deployment has also resulted in more ERP costs being borne by the five
operating business segments rather than Corporate and Unallocated. This negatively impacted each business segment’s
annual 2013 operating income margins by approximately 0.30 percentage points when compared to 2012. 3M’s pension
and postretirement benefit expenses declined $97 million when comparing 2013 to 2012; however, $127 million of this
reduction was allocated to Corporate and Unallocated, resulting in $30 million of additional expense being absorbed by
the five operating business segments in 2013, or a negative year-on-year impact of approximately 0.10 percentage points.
Thus, while operating income margins have declined when comparing 2013 to 2012 for all five business segments, on
average approximately 0.40 percentage points of this decline relates to the impact of higher ERP implementation
expenses and higher pension and postretirement benefit expenses. When comparing 2012 to 2011, operating business
segment results reflect $32 million in higher year-on-year pension and postretirement benefit expenses.
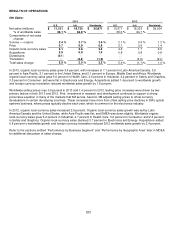
The following discusses total year results for 2013 compared to 2012, and also discusses 2012 compared to 2011, for
each business segment.