3M 2013 Annual Report Download - page 70
Download and view the complete annual report
Please find page 70 of the 2013 3M annual report below. You can navigate through the pages in the report by either clicking on the pages listed below, or by using the keyword search tool below to find specific information within the annual report.-
 1
1 -
2
-
3
-
4
-
5
-
6
-
7
-
8
-
9
-
10
-
11
-
12
-
13
-
14
-
15
-
16
-
17
-
18
-
19
-
20
-
21
-
22
-
23
-
24
-
25
-
26
-
27
-
28
-
29
-
30
-
31
-
32
-
33
-
34
-
35
-
36
-
37
-
38
-
39
-
40
-
41
-
42
-
43
-
44
-
45
-
46
-
47
-
48
-
49
-
50
-
51
-
52
-
53
-
54
-
55
-
56
-
57
-
58
-
59
-
 60
60 -
 61
61 -
 62
62 -
 63
63 -
 64
64 -
 65
65 -
 66
66 -
 67
67 -
 68
68 -
 69
69 -
 70
70 -
 71
71 -
 72
72 -
 73
73 -
 74
74 -
 75
75 -
 76
76 -
 77
77 -
 78
78 -
 79
79 -
 80
80 -
81
-
82
-
83
-
84
-
85
-
86
-
87
-
88
-
89
-
90
-
91
-
92
-
93
-
94
-
95
-
96
-
97
-
98
-
99
-
100
-
101
-
102
-
103
-
104
-
105
-
106
-
107
-
108
-
109
-
110
-
111
-
112
-
113
-
114
-
115
-
116
-
117
-
118
-
119
-
120
-
121
-
122
-
123
-
124
-
125
-
126
-
127
-
128
-
129
-
130
-
131
-
132
 |
 |

64
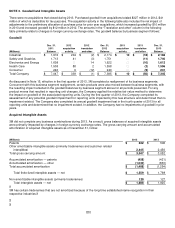
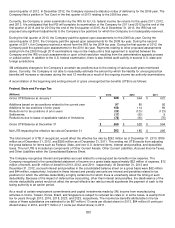
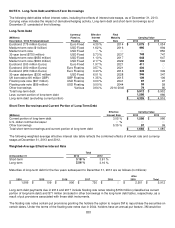
NOTE 4. Supplemental Balance Sheet Information
Accounts payable (included as a separate line item in the Consolidated Balance Sheet) includes drafts payable on
demand of $24 million at December 31, 2013, and $74 million at December 31, 2012. Accumulated depreciation for
capital leases totaled $85 million and $73 million as of December 31, 2013, and 2012, respectively. Additional
supplemental balance sheet information is provided in the table that follows.
(Millions)
2013
2012
Other
current assets
Prepaid expenses and other
$
602
$
555
Deferred income taxes
502
472
Derivative assets-current
76
49
Product and other insurance receivables
99
125
Total other current assets
$
1,279
$
1,201
Investments
Equity method
$
69
$
105
Cost method
45
47
Other investments
8
11
Total investments
$
122
$
163
Property, plant and equipment
-
at cost
Land
$
411
$
413
Buildings and leasehold improvements
7,062
6,975
Machinery and equipment
14,665
14,190
Construction in progress
772
791
Capital leases
158
156
Gross property, plant and equipment
23,068
22,525
Accumulated depreciation
(14,416)
(14,147)
Property, plant and equipment - net
$
8,652
$
8,378
Other assets
Deferred income taxes
$
360
$
578
Product and other insurance receivables
96
139
Cash surrender value of life insurance policies
236
230
Other assets
288
270
Total other assets
$
980
$
1,217
Other current liabilities
Accrued trade payables
$
547
$
516
Deferred income
521
471
Derivative liabilities
103
106
Dividends payable
567
―
Employee benefits and withholdings
195
178
Product and other claims
119
147
Property and other taxes
88
87
Pension and postretirement benefits
61
55
Deferred income taxes
37
45
Other
653
676
Total other current liabilities
$
2,891
$
2,281
Other
liabilities
Long term income taxes payable
$
472
$
454
Employee benefits
315
332
Product and other claims
314
314
Capital lease obligations
58
71
Deferred income
19
29
Deferred income taxes
538
167
Other
268
267
Total other liabilities
$
1,984
$
1,634