United Healthcare 2012 Annual Report Download - page 99
Download and view the complete annual report
Please find page 99 of the 2012 United Healthcare annual report below. You can navigate through the pages in the report by either clicking on the pages listed below, or by using the keyword search tool below to find specific information within the annual report.-
 1
1 -
2
-
3
-
4
-
5
-
6
-
7
-
8
-
9
-
10
-
11
-
12
-
13
-
14
-
15
-
16
-
17
-
18
-
19
-
20
-
21
-
22
-
23
-
24
-
25
-
26
-
27
-
28
-
29
-
30
-
31
-
32
-
33
-
34
-
35
-
36
-
37
-
38
-
39
-
40
-
41
-
42
-
43
-
44
-
45
-
46
-
47
-
48
-
49
-
50
-
51
-
52
-
53
-
54
-
55
-
56
-
57
-
58
-
59
-
60
-
61
-
62
-
63
-
64
-
65
-
66
-
67
-
68
-
69
-
70
-
71
-
72
-
73
-
74
-
75
-
76
-
77
-
78
-
79
-
80
-
81
-
82
-
83
-
84
-
85
-
86
-
87
-
88
-
 89
89 -
 90
90 -
 91
91 -
 92
92 -
 93
93 -
 94
94 -
 95
95 -
 96
96 -
 97
97 -
 98
98 -
 99
99 -
 100
100 -
 101
101 -
 102
102 -
 103
103 -
 104
104 -
 105
105 -
 106
106 -
 107
107 -
 108
108 -
 109
109 -
110
-
111
-
112
-
113
-
114
-
115
-
116
-
117
-
118
-
119
-
120
-
121
-
122
-
123
-
124
-
125
-
126
-
127
-
128
 |
 |

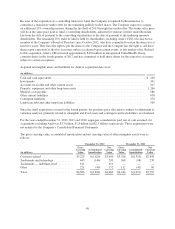
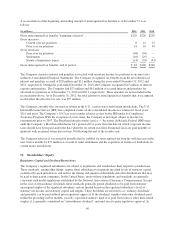
2012, based on the 2011 statutory net income and statutory capital and surplus levels, the maximum amount of
ordinary dividends that could have been paid by the Company’s U.S. regulated subsidiaries to their parent
companies was $4.6 billion.
For the year ended December 31, 2012, the Company’s regulated subsidiaries paid their parent companies
dividends of $4.9 billion, including $1.2 billion of extraordinary dividends. For the year ended December 31,
2011, the Company’s regulated subsidiaries paid their parent companies dividends of $4.5 billion, including
$1.1 billion of extraordinary dividends. As of December 31, 2012, $1.1 billion of the Company’s $8.4 billion of
cash and cash equivalents was held by non-regulated entities.
The Company’s regulated subsidiaries had estimated aggregate statutory capital and surplus of approximately
$13 billion as of December 31, 2012; regulated entity statutory capital exceeded aggregate minimum capital
requirements.
Optum Bank must meet minimum requirements for Tier 1 leverage capital, Tier 1 risk-based capital, and Total
risk-based capital of the Federal Deposit Insurance Corporation (FDIC) to be considered “Well Capitalized”
under the capital adequacy rules to which it is subject. At December 31, 2012, the Company believes that Optum
Bank met the FDIC requirements to be considered “Well Capitalized.”
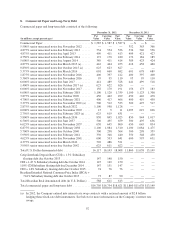
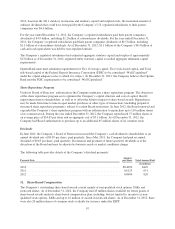
Share Repurchase Program
Under its Board of Directors’ authorization, the Company maintains a share repurchase program. The objectives
of the share repurchase program are to optimize the Company’s capital structure and cost of capital, thereby
improving returns to shareholders, as well as to offset the dilutive impact of share-based awards. Repurchases
may be made from time to time in open market purchases or other types of transactions (including prepaid or
structured share repurchase programs), subject to certain Board restrictions. In June 2012, the Board renewed and
expanded the Company’s share repurchase program with an authorization to repurchase up to 110 million shares
of its common stock. During the year ended December 31, 2012, the Company repurchased 57 million shares at
an average price of $54.45 per share and an aggregate cost of $3.1 billion. As of December 31, 2012, the
Company had Board authorization to purchase up to an additional 85 million shares of its common stock.
Dividends
In June 2012, the Company’s Board of Directors increased the Company’s cash dividend to shareholders to an
annual dividend rate of $0.85 per share, paid quarterly. Since May 2011, the Company had paid an annual
dividend of $0.65 per share, paid quarterly. Declaration and payment of future quarterly dividends is at the
discretion of the Board and may be adjusted as business needs or market conditions change.
The following table provides details of the Company’s dividend payments:
Payment Date
Amount
per Share Total Amount Paid
(in millions)
2010 ............................................................... $0.4050 $449
2011 ............................................................... 0.6125 651
2012 ............................................................... 0.8000 820
11. Share-Based Compensation
The Company’s outstanding share-based awards consist mainly of non-qualified stock options, SARs and
restricted shares. As of December 31, 2012, the Company had 43 million shares available for future grants of
share-based awards under its share-based compensation plan, including, but not limited to, incentive or non-
qualified stock options, SARs and up to 16 million of awards in restricted shares. As of December 31, 2012, there
were also 20 million shares of common stock available for issuance under the ESPP.
97