United Healthcare 2012 Annual Report Download - page 86
Download and view the complete annual report
Please find page 86 of the 2012 United Healthcare annual report below. You can navigate through the pages in the report by either clicking on the pages listed below, or by using the keyword search tool below to find specific information within the annual report.-
 1
1 -
2
-
3
-
4
-
5
-
6
-
7
-
8
-
9
-
10
-
11
-
12
-
13
-
14
-
15
-
16
-
17
-
18
-
19
-
20
-
21
-
22
-
23
-
24
-
25
-
26
-
27
-
28
-
29
-
30
-
31
-
32
-
33
-
34
-
35
-
36
-
37
-
38
-
39
-
40
-
41
-
42
-
43
-
44
-
45
-
46
-
47
-
48
-
49
-
50
-
51
-
52
-
53
-
54
-
55
-
56
-
57
-
58
-
59
-
60
-
61
-
62
-
63
-
64
-
65
-
66
-
67
-
68
-
69
-
70
-
71
-
72
-
73
-
74
-
75
-
 76
76 -
 77
77 -
 78
78 -
 79
79 -
 80
80 -
 81
81 -
 82
82 -
 83
83 -
 84
84 -
 85
85 -
 86
86 -
 87
87 -
 88
88 -
 89
89 -
 90
90 -
 91
91 -
 92
92 -
 93
93 -
 94
94 -
 95
95 -
 96
96 -
97
-
98
-
99
-
100
-
101
-
102
-
103
-
104
-
105
-
106
-
107
-
108
-
109
-
110
-
111
-
112
-
113
-
114
-
115
-
116
-
117
-
118
-
119
-
120
-
121
-
122
-
123
-
124
-
125
-
126
-
127
-
128
 |
 |
4. Fair Value
Certain assets and liabilities are measured at fair value in the Consolidated Financial Statements or have fair
values disclosed in the Notes to the Consolidated Financial Statements. These assets and liabilities are classified
into one of three levels of a hierarchy defined by GAAP. In instances in which the inputs used to measure fair
value fall into different levels of the fair value hierarchy, the fair value measurement is categorized in its entirety
based on the lowest level input that is significant to the fair value measurement in its entirety. The Company’s
assessment of the significance of a particular item to the fair value measurement in its entirety requires judgment,
including the consideration of inputs specific to the asset or liability.
The fair value hierarchy is summarized as follows:
Level 1 — Quoted prices (unadjusted) for identical assets/liabilities in active markets.
Level 2 — Other observable inputs, either directly or indirectly, including:
• Quoted prices for similar assets/liabilities in active markets;
• Quoted prices for identical or similar assets/liabilities in non-active markets (e.g., few transactions,
limited information, non-current prices, high variability over time);
• Inputs other than quoted prices that are observable for the asset/liability (e.g., interest rates, yield
curves, implied volatilities, credit spreads); and
• Inputs that are corroborated by other observable market data.
Level 3 — Unobservable inputs that cannot be corroborated by observable market data.
Transfers between levels, if any, are recorded as of the beginning of the reporting period in which the transfer
occurs; there were no transfers between Levels 1, 2 or 3 of any financial assets or liabilities during 2012 or 2011.
Non-financial assets and liabilities or financial assets and liabilities that are measured at fair value on a
nonrecurring basis are subject to fair value adjustments only in certain circumstances, such as when the Company
records an impairment. There were no significant fair value adjustments for these assets and liabilities recorded
during the years ended December 31, 2012, 2011, and 2010.
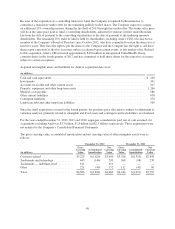
The following methods and assumptions were used to estimate the fair value and determine the fair value
hierarchy classification of each class of financial instrument included in the tables below:
Cash and Cash Equivalents. The carrying value of cash and cash equivalents approximates fair value as
maturities are less than three months. Fair values of cash equivalent instruments that do not trade on a regular
basis in active markets are classified as Level 2.
Debt and Equity Securities. Fair values of debt and equity securities are based on quoted market prices, where
available. The Company obtains one price for each security primarily from a third-party pricing service (pricing
service), which generally uses quoted or other observable inputs for the determination of fair value. The pricing
service normally derives the security prices through recently reported trades for identical or similar securities,
and, if necessary, makes adjustments through the reporting date based upon available observable market
information. For securities not actively traded, the pricing service may use quoted market prices of comparable
instruments or discounted cash flow analyses, incorporating inputs that are currently observable in the markets
for similar securities. Inputs that are often used in the valuation methodologies include, but are not limited to,
benchmark yields, credit spreads, default rates, prepayment speeds and non-binding broker quotes. As the
Company is responsible for the determination of fair value, it performs quarterly analyses on the prices received
from the pricing service to determine whether the prices are reasonable estimates of fair value. Specifically, the
Company compares the prices received from the pricing service to a secondary pricing source, prices reported by
its custodian, its investment consultant and third-party investment advisors. Additionally, the Company compares
84