United Healthcare 2012 Annual Report Download - page 43
Download and view the complete annual report
Please find page 43 of the 2012 United Healthcare annual report below. You can navigate through the pages in the report by either clicking on the pages listed below, or by using the keyword search tool below to find specific information within the annual report.-
 1
1 -
2
-
3
-
4
-
5
-
6
-
7
-
8
-
9
-
10
-
11
-
12
-
13
-
14
-
15
-
16
-
17
-
18
-
19
-
20
-
21
-
22
-
23
-
24
-
25
-
26
-
27
-
28
-
29
-
30
-
31
-
32
-
 33
33 -
 34
34 -
 35
35 -
 36
36 -
 37
37 -
 38
38 -
 39
39 -
 40
40 -
 41
41 -
 42
42 -
 43
43 -
 44
44 -
 45
45 -
 46
46 -
 47
47 -
 48
48 -
 49
49 -
 50
50 -
 51
51 -
 52
52 -
 53
53 -
54
-
55
-
56
-
57
-
58
-
59
-
60
-
61
-
62
-
63
-
64
-
65
-
66
-
67
-
68
-
69
-
70
-
71
-
72
-
73
-
74
-
75
-
76
-
77
-
78
-
79
-
80
-
81
-
82
-
83
-
84
-
85
-
86
-
87
-
88
-
89
-
90
-
91
-
92
-
93
-
94
-
95
-
96
-
97
-
98
-
99
-
100
-
101
-
102
-
103
-
104
-
105
-
106
-
107
-
108
-
109
-
110
-
111
-
112
-
113
-
114
-
115
-
116
-
117
-
118
-
119
-
120
-
121
-
122
-
123
-
124
-
125
-
126
-
127
-
128
 |
 |
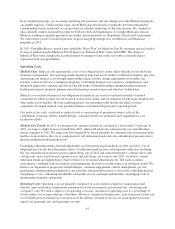
In government programs, we are seeing continuing rate pressures, and rate changes for some Medicaid programs
are slightly negative. Unlike in prior years, recent Medicaid reductions have generally not been mitigated by
corresponding benefit reductions or care provider fee schedule reductions by the state sponsor. We continue to
take a prudent, market-sustainable posture for both new bids and maintenance of existing Medicaid contracts.
Medicare funding is similarly pressured; see further discussion below in “Regulatory Trends and Uncertainties.”
We expect these factors to result in pressure on gross margin percentages for our Medicare and Medicaid
programs in 2013.
In 2013, UnitedHealthcare created a new affordable “Basic Plan” for Medicare Part D consumers and reclassified
its large 4 million member Medicare Part D plan to an “Enhanced Plan” status with CMS. The change to
Enhanced Plan status changes the seasonal pattern of earnings to later in the year with no material impact
expected on full year profitability.
Operating Costs
Medical Costs. Medical costs represent the costs of our obligations for claims and/or benefits of our risk-based
insurance arrangements. Our operating results depend in large part on our ability to effectively estimate, price for
and manage our medical costs through underwriting criteria, product design, negotiation of favorable care
provider contracts and care coordination programs. Controlling medical costs requires a comprehensive and
integrated approach to organize and advance the full range of interrelationships among patients/consumers,
health professionals, hospitals, pharmaceutical/technology manufacturers and other key stakeholders.
Medical costs include estimates of our obligations for medical care services rendered on behalf of insured
consumers for which we have not yet received or processed claims, and our estimates for physician, hospital and
other medical cost disputes. In every reporting period, our operating results include the effects of more
completely developed medical costs payable estimates associated with previously reported periods.
Our medical care ratio, calculated as medical costs as a percentage of premium revenues, reflects the
combination of pricing, rebates, benefit designs, consumer health care utilization and comprehensive care
facilitation efforts.
Medical Cost Trends. In 2012, we managed our commercial medical cost trend to a level under 5.5 percent. In
2013, we expect a slight increase in trend from 2012, albeit with relatively consistent unit cost and utilization
trends compared to 2012. We expect our total trend will be driven primarily by continued unit cost pressure from
health care providers as they try to compensate for soft utilization trends and cross-subsidization pressure due to
their government reimbursement levels.
Underlying utilization trends declined significantly in 2010 and increased modestly in 2011 and 2012. Use of
outpatient services has been the primary driver of utilization trend increase, with inpatient utilization declining.
We also experienced an increase in prescription drug costs in 2012 and expect that trend to continue due to unit
cost pressure and a trend towards expensive new specialty drugs. As we move into 2013, we believe current
utilization trends are slightly below what we believe to be normal utilization levels. The weak economic
environment, combined with our medical cost management, has had a favorable impact on utilization trends. We
believe our alignment of progressive benefit designs, consumer engagement, clinical management, pay-for-
performance reimbursement programs for care providers and network resources is favorably controlling medical
and pharmacy costs, enhancing affordability and quality for our customers and members and helping to drive
strong market response and growth.
Operating Costs. Operating costs are primarily comprised of costs related to employee compensation and
benefits, agent and broker commissions, premium taxes and assessments, professional fees, advertising and
occupancy costs. We seek to improve our operating cost ratio, calculated as operating costs as a percentage of
total revenues, for an equivalent mix of business. However, changes in business mix, such as increases in the size
of our health services businesses or an increase in the delivery of medical services on an integrated basis may
impact our operating costs and operating cost ratio.
41