United Healthcare 2012 Annual Report Download - page 59
Download and view the complete annual report
Please find page 59 of the 2012 United Healthcare annual report below. You can navigate through the pages in the report by either clicking on the pages listed below, or by using the keyword search tool below to find specific information within the annual report.-
 1
1 -
2
-
3
-
4
-
5
-
6
-
7
-
8
-
9
-
10
-
11
-
12
-
13
-
14
-
15
-
16
-
17
-
18
-
19
-
20
-
21
-
22
-
23
-
24
-
25
-
26
-
27
-
28
-
29
-
30
-
31
-
32
-
33
-
34
-
35
-
36
-
37
-
38
-
39
-
40
-
41
-
42
-
43
-
44
-
45
-
46
-
47
-
48
-
 49
49 -
 50
50 -
 51
51 -
 52
52 -
 53
53 -
 54
54 -
 55
55 -
 56
56 -
 57
57 -
 58
58 -
 59
59 -
 60
60 -
 61
61 -
 62
62 -
 63
63 -
 64
64 -
 65
65 -
 66
66 -
 67
67 -
 68
68 -
 69
69 -
70
-
71
-
72
-
73
-
74
-
75
-
76
-
77
-
78
-
79
-
80
-
81
-
82
-
83
-
84
-
85
-
86
-
87
-
88
-
89
-
90
-
91
-
92
-
93
-
94
-
95
-
96
-
97
-
98
-
99
-
100
-
101
-
102
-
103
-
104
-
105
-
106
-
107
-
108
-
109
-
110
-
111
-
112
-
113
-
114
-
115
-
116
-
117
-
118
-
119
-
120
-
121
-
122
-
123
-
124
-
125
-
126
-
127
-
128
 |
 |

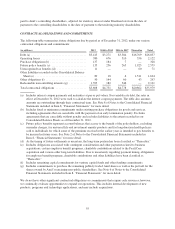
costs incurred in prior months for which more complete claim data is available, supplemented by a review of near-
term completion factors. This approach is consistently applied from period to period.
Completion Factors. Completion factors are the most significant factors we use in developing our medical costs
payable estimates for older periods, generally periods prior to the most recent three months. The completion
factor includes judgments in relation to claim submissions such as the time from date of service to claim receipt,
claim inventory levels and claim processing backlogs as well as other factors. If actual claims submission rates
from providers (which can be influenced by a number of factors including provider mix and electronic versus
manual submissions) or our claim processing patterns are different than estimated, our reserves may be
significantly impacted.
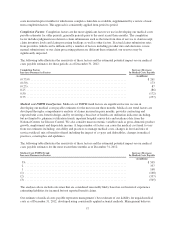
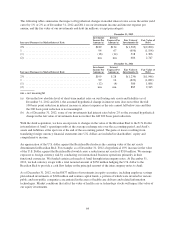
The following table illustrates the sensitivity of these factors and the estimated potential impact on our medical
costs payable estimates for those periods as of December 31, 2012:
Completion Factors
Increase (Decrease) in Factors
Increase (Decrease)
In Medical Costs Payable
(in millions)
(0.75)% ................................................................. $261
(0.50) ................................................................... 173
(0.25) ................................................................... 87
0.25 .................................................................... (86)
0.50 .................................................................... (172)
0.75 .................................................................... (257)
Medical cost PMPM trend factors. Medical cost PMPM trend factors are significant factors we use in
developing our medical costs payable estimates for the most recent three months. Medical cost trend factors are
developed through a comprehensive analysis of claims incurred in prior months, provider contracting and
expected unit costs, benefit design, and by reviewing a broad set of health care utilization indicators including,
but not limited to, pharmacy utilization trends, inpatient hospital census data and incidence data from the
National Centers for Disease Control. We also consider macroeconomic variables such as gross-domestic product
growth, employment and disposable income. A large number of factors can cause the medical cost trend to vary
from our estimates including: our ability and practices to manage medical costs, changes in level and mix of
services utilized, mix of benefits offered including the impact of co-pays and deductibles, changes in medical
practices, catastrophes and epidemics.
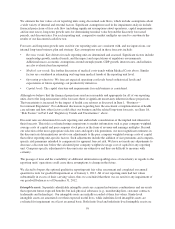
The following table illustrates the sensitivity of these factors and the estimated potential impact on our medical
costs payable estimates for the most recent three months as of December 31, 2012:
Medical Costs PMPM Trend
Increase (Decrease) in Factors
Increase (Decrease)
In Medical Costs Payable
(in millions)
3%.................................................................... $505
2 ..................................................................... 337
1 ..................................................................... 168
(1) ..................................................................... (168)
(2) ..................................................................... (337)
(3) ..................................................................... (505)
The analyses above include outcomes that are considered reasonably likely based on our historical experience
estimating liabilities for incurred but not reported benefit claims.
Our estimate of medical costs payable represents management’s best estimate of our liability for unpaid medical
costs as of December 31, 2012, developed using consistently applied actuarial methods. Management believes
57