United Healthcare 2012 Annual Report Download - page 50
Download and view the complete annual report
Please find page 50 of the 2012 United Healthcare annual report below. You can navigate through the pages in the report by either clicking on the pages listed below, or by using the keyword search tool below to find specific information within the annual report.-
 1
1 -
2
-
3
-
4
-
5
-
6
-
7
-
8
-
9
-
10
-
11
-
12
-
13
-
14
-
15
-
16
-
17
-
18
-
19
-
20
-
21
-
22
-
23
-
24
-
25
-
26
-
27
-
28
-
29
-
30
-
31
-
32
-
33
-
34
-
35
-
36
-
37
-
38
-
39
-
 40
40 -
 41
41 -
 42
42 -
 43
43 -
 44
44 -
 45
45 -
 46
46 -
 47
47 -
 48
48 -
 49
49 -
 50
50 -
 51
51 -
 52
52 -
 53
53 -
 54
54 -
 55
55 -
 56
56 -
 57
57 -
 58
58 -
 59
59 -
 60
60 -
61
-
62
-
63
-
64
-
65
-
66
-
67
-
68
-
69
-
70
-
71
-
72
-
73
-
74
-
75
-
76
-
77
-
78
-
79
-
80
-
81
-
82
-
83
-
84
-
85
-
86
-
87
-
88
-
89
-
90
-
91
-
92
-
93
-
94
-
95
-
96
-
97
-
98
-
99
-
100
-
101
-
102
-
103
-
104
-
105
-
106
-
107
-
108
-
109
-
110
-
111
-
112
-
113
-
114
-
115
-
116
-
117
-
118
-
119
-
120
-
121
-
122
-
123
-
124
-
125
-
126
-
127
-
128
 |
 |

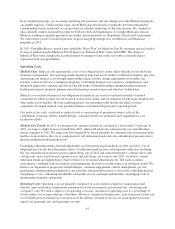
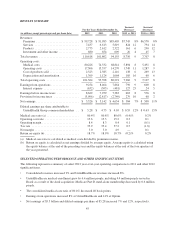
The following table summarizes the number of individuals served by our UnitedHealthcare businesses, by major
market segment and funding arrangement:
December 31,
Increase/
(Decrease)
Increase/
(Decrease)
(in thousands, except percentages) 2012 2011 2010 2012 vs. 2011 2011 vs. 2010
Commercial risk-based ........................... 9,340 9,550 9,405 (210) (2)% 145 2%
Commercial fee-based ............................ 17,585 16,320 15,405 1,265 8 915 6
Total commercial ................................ 26,925 25,870 24,810 1,055 4 1,060 4
Medicare Advantage (a) .......................... 2,565 2,165 2,005 400 18 160 8
Medicaid (a) ................................... 3,830 3,600 3,385 230 6 215 6
Medicare Supplement (Standardized) ................ 3,180 2,935 2,770 245 8 165 6
Total public and senior ........................... 9,575 8,700 8,160 875 10 540 7
International ................................... 4,425 — — 4,425 nm — —
Total UnitedHealthcare — medical .................. 40,925 34,570 32,970 6,355 18% 1,600 5%
Supplemental Data:
Medicare Part D stand-alone ..................... 4,225 4,855 4,530 (630) (13)% 325 7%
nm = not meaningful
(a) Earlier periods presented above have been recast such that all periods presented reflect the dually eligible
enrollment change from Medicare Advantage to Medicaid discussed above.
Commercial risk-based membership decreased in 2012 due to a competitive market environment, conversions to
fee-based products by large public sector clients that we retained and other decreases in the public sector. In fee-
based commercial products, the increase was due to a number of new business awards and strong customer
retention. Medicare Advantage increased due to strengthened execution in product design, marketing and local
engagement, which drove sales growth, combined with the addition of 185,000 Medicare Advantage members
from 2012 acquisitions. Medicaid growth was due to a combination of winning new state accounts and growth
within existing state customers, partially offset by a fourth quarter market withdrawal from one product in a
specific region, affecting 175,000 beneficiaries. Medicare Supplement growth was due to strong retention and
new sales. In our Medicare Part D stand-alone business, membership decreased primarily as a result of the first
quarter 2012 loss of approximately 470,000 auto-assigned low-income subsidy Medicare Part D beneficiaries,
due to pricing benchmarks for the government-subsidized low income Medicare Part D market coming in below
our bids in a number of regions. International represents commercial membership in Brazil added as a result of
the Amil acquisition in 2012.
UnitedHealthcare’s revenue growth in 2012 was primarily due to growth in the number of individuals served,
commercial premium rate increases related to expected increases in underlying medical cost trends and the
impact of lower premium rebates.
UnitedHealthcare’s earnings from operations for 2012 increased compared to the prior year primarily due to the
factors that increased revenues combined with an improvement in the medical care ratio driven by effective
management of medical costs and increased favorable medical reserve development. The favorable development
for 2012 was driven by lower than expected health system utilization levels and increased efficiency in claims
handling and processing.
In March 2012, UnitedHealthcare Military & Veterans was awarded the TRICARE West Region Managed Care
Support Contract. The contract, for health care operations, includes a transition period and five one-year renewals
at the government’s option. The first year of operations is anticipated to begin April 1, 2013. The base
administrative services contract is expected to generate a total of $1.4 billion in revenues over the five years.
48