United Healthcare 2012 Annual Report Download - page 72
Download and view the complete annual report
Please find page 72 of the 2012 United Healthcare annual report below. You can navigate through the pages in the report by either clicking on the pages listed below, or by using the keyword search tool below to find specific information within the annual report.-
 1
1 -
2
-
3
-
4
-
5
-
6
-
7
-
8
-
9
-
10
-
11
-
12
-
13
-
14
-
15
-
16
-
17
-
18
-
19
-
20
-
21
-
22
-
23
-
24
-
25
-
26
-
27
-
28
-
29
-
30
-
31
-
32
-
33
-
34
-
35
-
36
-
37
-
38
-
39
-
40
-
41
-
42
-
43
-
44
-
45
-
46
-
47
-
48
-
49
-
50
-
51
-
52
-
53
-
54
-
55
-
56
-
57
-
58
-
59
-
60
-
61
-
 62
62 -
 63
63 -
 64
64 -
 65
65 -
 66
66 -
 67
67 -
 68
68 -
 69
69 -
 70
70 -
 71
71 -
 72
72 -
 73
73 -
 74
74 -
 75
75 -
 76
76 -
 77
77 -
 78
78 -
 79
79 -
 80
80 -
 81
81 -
 82
82 -
83
-
84
-
85
-
86
-
87
-
88
-
89
-
90
-
91
-
92
-
93
-
94
-
95
-
96
-
97
-
98
-
99
-
100
-
101
-
102
-
103
-
104
-
105
-
106
-
107
-
108
-
109
-
110
-
111
-
112
-
113
-
114
-
115
-
116
-
117
-
118
-
119
-
120
-
121
-
122
-
123
-
124
-
125
-
126
-
127
-
128
 |
 |

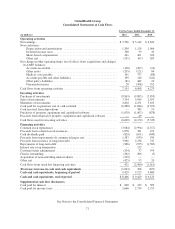
UnitedHealth Group
Consolidated Statements of Changes in Shareholders’ Equity
Common Stock
Accumulated Other
Comprehensive Income
(Loss)
Additional
Paid-In Retained
Net
Unrealized
Gains on
Foreign
Currency
Translation
(Losses)
(in millions) Shares Amount Capital Earnings Investments Gains Total Equity
Balance at January 1, 2010 ..... 1,147 $11 $ — $23,342 $277 $(24) $23,606
Net earnings .................. 4,634 4,634
Other comprehensive income .... 3 (4) (1)
Issuances of common stock, and
related tax effects ............ 15 — 207 207
Share-based compensation, and
related tax benefits ........... 345 345
Common stock repurchases ...... (76) — (552) (1,965) (2,517)
Cash dividends paid on common
stock ...................... (449) (449)
Balance at December 31, 2010 . . 1,086 11 — 25,562 280 (28) 25,825
Net earnings .................. 5,142 5,142
Other comprehensive income .... 196 13 209
Issuances of common stock, and
related tax effects ............ 18 — 308 308
Share-based compensation, and
related tax benefits ........... 453 453
Common stock repurchases ...... (65) (1) (761) (2,232) (2,994)
Cash dividends paid on common
stock ...................... (651) (651)
Balance at December 31, 2011 . . 1,039 10 — 27,821 476 (15) 28,292
Net earnings .................. 5,526 5,526
Other comprehensive income .... 40 (63) (23)
Issuances of common stock, and
related tax effects ............ 37 — 704 704
Share-based compensation, and
related tax benefits ........... 594 594
Common stock repurchases ...... (57) — (1,221) (1,863) (3,084)
Acquisition of noncontrolling
interest .................... (11) (11)
Cash dividends paid on common
stock ...................... (820) (820)
Balance at December 31, 2012 . . 1,019 $10 $ 66 $30,664 $516 $(78) $31,178
See Notes to the Consolidated Financial Statements
70