Under Armour 2014 Annual Report Download - page 87
Download and view the complete annual report
Please find page 87 of the 2014 Under Armour annual report below. You can navigate through the pages in the report by either clicking on the pages listed below, or by using the keyword search tool below to find specific information within the annual report.-
 1
1 -
2
-
3
-
4
-
5
-
6
-
7
-
8
-
9
-
10
-
11
-
12
-
13
-
14
-
15
-
16
-
17
-
18
-
19
-
20
-
21
-
22
-
23
-
24
-
25
-
26
-
27
-
28
-
29
-
30
-
31
-
32
-
33
-
34
-
35
-
36
-
37
-
38
-
39
-
40
-
41
-
42
-
43
-
44
-
45
-
46
-
47
-
48
-
49
-
50
-
51
-
52
-
53
-
54
-
55
-
56
-
57
-
58
-
59
-
60
-
61
-
62
-
63
-
64
-
65
-
66
-
67
-
68
-
69
-
70
-
71
-
72
-
73
-
74
-
75
-
76
-
 77
77 -
 78
78 -
 79
79 -
 80
80 -
 81
81 -
 82
82 -
 83
83 -
 84
84 -
 85
85 -
 86
86 -
 87
87 -
 88
88 -
 89
89 -
 90
90 -
 91
91 -
 92
92 -
 93
93 -
 94
94 -
 95
95 -
 96
96 -
 97
97 -
98
-
99
-
100
-
101
-
102
-
103
-
104
 |
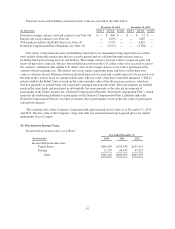
 |

Year Ended December 31,
(
In t
h
ousan
d
s
)
2
0
14 201
3
2
0
12
O
perating income
(
loss
)
North America
$
372,347
$
271,338
$
200,084
O
ther foreign countries and businesses (18,392) (
6
,240) 8,
6
11
Total operatin
g
income 353,955 265,098 208,69
5
Interest expense, net (5,335) (2,933) (5,183)
Other expense, net (6,410) (1,172) (73)
I
ncome before income taxes $342,210 $260,993 $203,43
9
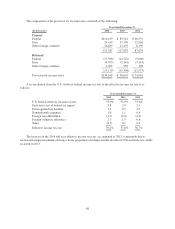
N
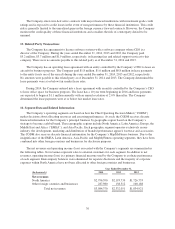
et revenues
by
pro
d
uct cate
g
or
y
are as
f
o
ll
ows:
Year Ended December
31,
(In thousands)
2014
2013
2012
Apparel $2,291,520 $1,762,150 $1,385,35
0
Footwear 430,987 298,825 238,95
5
Accessories 275,425 216,098 165,83
5
T
otal net sales 2,997,932 2,277,073 1,790,14
0
Licensing and other revenues 86,438
5
4,978 44,781
T
otal net revenues
$
3
,
084
,
370
$
2
,
332
,
051
$
1
,
834
,
921
A
so
f
Decem
b
er 31, 2014 an
d
2013, t
h
ema
j
or
i
ty o
f
t
h
e Company’s
l
ong-
li
ve
d
assets were
l
ocate
di
nt
he
U
nited States. Net revenues in the United States were
$
2
,
670.4 million
,$
2
,
082.5 million and
$
1
,
650.4 million for
t
h
e years en
d
e
d
Decem
b
er 31, 2014, 2013 an
d
2012, respect
i
ve
l
y.
1
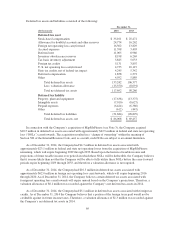
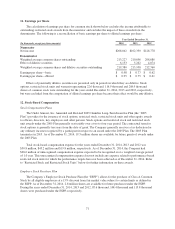
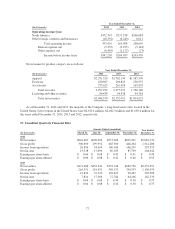
7. Unaudited Quarterly Financial Dat
a
Q
uarter Ended (unaudited)
Y
ear
E
n
d
e
d
D
ecember 31,
(
In t
h
ousan
d
s
)
M
arch 31
,
J
une 30
,
S
eptember 30, December 31,
2
0
14
Net revenues $641,607 $609,654 $937,908 $895,201 $3,084,37
0
G
ross profit 300,690 299,952 465,300 446,264 1,512,20
6
Income from operations 26,856 34,694 146,106 146,299 353,955
Net income 13,538 17,690 89,105 87,709 208,042
Earnin
g
s per share-basic $ 0.06 $ 0.08 $ 0.42 $ 0.41 $ 0.98
Earnin
g
s per share-diluted $ 0.06 $ 0.08 $ 0.41 $ 0.40 $ 0.95
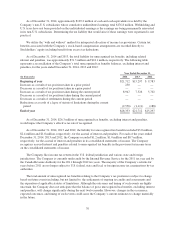
201
3
Net revenues
$
471,608
$
454,541
$
723,146
$
682,756
$
2,332,051
G
ross
p
rofit 216,
55
1 219,631 3
5
0,13
5
3
5
0,3
5
3 1,136,670
Income from o
p
erations 13,492 32,310 120,829 98,467 26
5
,098
Net income 7,814 17,
5
66 72,784 64,166 162,330
Earnings per share-basic
$
0.04
$
0.08
$
0.34
$
0.30
$
0.7
7
Earnings per share-diluted
$
0.04
$
0.08
$
0.34
$
0.30
$
0.75
77