Under Armour 2014 Annual Report Download - page 42
Download and view the complete annual report
Please find page 42 of the 2014 Under Armour annual report below. You can navigate through the pages in the report by either clicking on the pages listed below, or by using the keyword search tool below to find specific information within the annual report.-
 1
1 -
2
-
3
-
4
-
5
-
6
-
7
-
8
-
9
-
10
-
11
-
12
-
13
-
14
-
15
-
16
-
17
-
18
-
19
-
20
-
21
-
22
-
23
-
24
-
25
-
26
-
27
-
28
-
29
-
30
-
31
-
 32
32 -
 33
33 -
 34
34 -
 35
35 -
 36
36 -
 37
37 -
 38
38 -
 39
39 -
 40
40 -
 41
41 -
 42
42 -
 43
43 -
 44
44 -
 45
45 -
 46
46 -
 47
47 -
 48
48 -
 49
49 -
 50
50 -
 51
51 -
 52
52 -
53
-
54
-
55
-
56
-
57
-
58
-
59
-
60
-
61
-
62
-
63
-
64
-
65
-
66
-
67
-
68
-
69
-
70
-
71
-
72
-
73
-
74
-
75
-
76
-
77
-
78
-
79
-
80
-
81
-
82
-
83
-
84
-
85
-
86
-
87
-
88
-
89
-
90
-
91
-
92
-
93
-
94
-
95
-
96
-
97
-
98
-
99
-
100
-
101
-
102
-
103
-
104
 |
 |
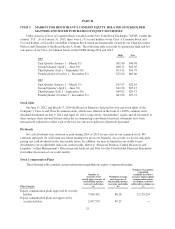
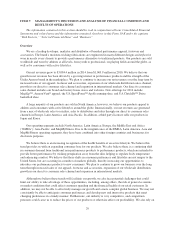
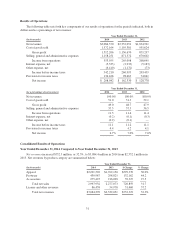
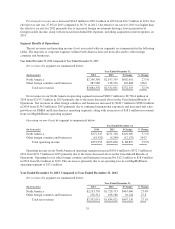
Net sale
s
increased
$
720.8 million, or 31.7%, to
$
2,997.9 million in 2014 from
$
2,277.1 million in 2013.
T
he increase in net sales primarily reflects:
•
$220.5 million, or 31.5%, increase in North America direct to consumer sales driven b
y
a 17% increas
e
i
n square
f
oota
g
e
i
n our
f
actor
yh
ouse stores,
i
nc
l
u
di
n
g
an 7%
i
ncrease
i
n new stores, s
i
nce Decem
b
e
r
2013, a
l
on
g
w
i
t
h
cont
i
nue
dg
rowt
hi
n our e-commerce
b
us
i
ness;
•$
128.5 million, or 108.4% increase in net sales in other foreign countries, primarily due to increased
di
str
ib
ut
i
on an
d
un
i
tvo
l
ume growt
hi
n our EMEA an
d
Lat
i
n Amer
i
ca operat
i
ng segments; an
d
•
unit growth driven by increased distribution and new offerings in multiple product categories,
i
ncluding continued growth of our training, outdoor and golf apparel product lines, along with growt
h
i
n footwear due to a broader assortment of running and basketball shoes, including our new U
A
S
p
eedFor
m
™
f
ootwear.
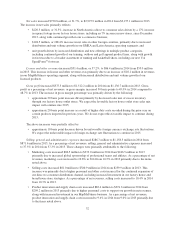
License and other revenues
i
ncreased
$
31.4 million, or 57.2%, to
$
86.4 million in 2014 from
$
55.0 millio
n
in 2013. This increase in license and other revenues was primarily due to an increase of
$
18.1 million in revenues
in our MapMyFitness operating segment, along with increased distribution and unit volume growth of our
licensed
p
roducts.
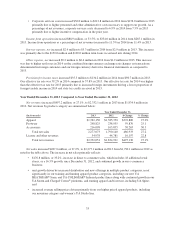
G
ross pro
f
it
i
ncreased
$
375.5 million to
$
1,512.2 million in 2014 from
$
1,136.7 million in 2013. Gros
s
p
rofit as a percentage of net revenues, or gross margin, increased 30 basis points to 49.0% in 2014 compared t
o
48.7% in 2013. The increase in gross margin percentage was primarily driven by the following:
•
approx
i
mate 20
b
as
i
spo
i
nt
i
ncrease
d
r
i
ven pr
i
mar
ily by d
ecrease
d
sa
l
es m
i
xo
f
excess
i
nventor
y
th
rou
gh
our
f
actor
yh
ouse out
l
et stores. We expect t
h
e
f
avora
bl
e
f
actor
yh
ouse out
l
et store sa
l
es m
i
x
i
mpact will continue into 2015
;
•
approx
i
mate 20
b
as
i
spo
i
nt
i
ncrease as a resu
l
to
fhi
g
h
er
d
uty costs recor
d
e
dd
ur
i
ng t
h
epr
i
or year on
c
erta
i
n pro
d
ucts
i
mporte
di
n prev
i
ous years. We
d
o not expect t
hi
s
f
avora
bl
e
i
mpact to cont
i
nue
d
ur
i
n
g
201
5;
T
h
ea
b
ove
i
ncreases were part
i
a
ll
yo
ff
set
b
y:
•
approximate 10 basis point decrease driven by unfavorable foreign currency exchange rate fluctuations.
W
e expect the unfavorable impact of foreign exchange rate fluctuations to continue in 201
5.
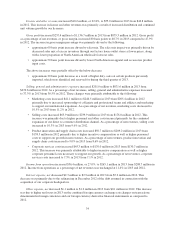
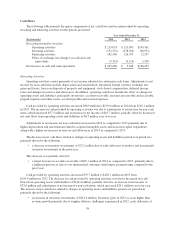
Selling, general and administrative expense
s
increased
$
286.7 million to
$
1,158.3 million in 2014 fro
m
$
871.6 million in 2013. As a percentage of net revenues, selling, general and administrative expenses increase
d
to 37.
5
% in 2014 from 37.3% in 2013. These changes were primarily attributable to the following
:
•
Marketin
g
costs increased $86.5 million to $333.0 million in 2014 from $246.5 million in 2013
pr
i
mar
ily d
ue to
i
ncrease
dgl
o
b
a
l
sponsors
hi
po
f
pro
f
ess
i
ona
l
teams an
d
at
hl
etes. As a percenta
g
eo
f
ne
t
revenues, marketin
g
costs increased to 10.8% in 2014 from 10.5% in 2013 primaril
y
due to the items
n
oted abo
v
e.
•
Selling costs increased $81.0 million to $320.9 million in 2014 from $239.9 million in 2013. This
i
ncrease was pr
i
mar
il
y
d
ue to
hi
g
h
er personne
l
an
d
ot
h
er costs
i
ncurre
df
or t
h
e cont
i
nue
d
expans
i
on o
f
our
di
rect to consumer
di
str
ib
ut
i
on c
h
anne
l
,
i
nc
l
u
di
ng
i
ncrease
di
nvestment
i
n our
f
actory
h
ouse an
d
b
ran
dh
ouse store strateg
i
es. As a percentage o
f
net revenues, se
lli
ng costs
i
ncrease
d
to 10.4%
i
n 201
4
f
rom 10.3%
i
n 2013.
•
Product innovation and supply chain costs increased
$
82.4 million to
$
291.6 million in 2014 fro
m
$
209.2 million in 2013 primarily due to higher personnel costs to support our growth in net revenues,
a
long with increased investment in our MapMyFitness business. As a percentage of net revenues
,
product innovation and supply chain costs increased to 9.4% in 2014 from 9.0% in 2013 primarily due
t
o the items noted above
.
32