Under Armour 2014 Annual Report Download - page 48
Download and view the complete annual report
Please find page 48 of the 2014 Under Armour annual report below. You can navigate through the pages in the report by either clicking on the pages listed below, or by using the keyword search tool below to find specific information within the annual report.-
 1
1 -
2
-
3
-
4
-
5
-
6
-
7
-
8
-
9
-
10
-
11
-
12
-
13
-
14
-
15
-
16
-
17
-
18
-
19
-
20
-
21
-
22
-
23
-
24
-
25
-
26
-
27
-
28
-
29
-
30
-
31
-
32
-
33
-
34
-
35
-
36
-
37
-
 38
38 -
 39
39 -
 40
40 -
 41
41 -
 42
42 -
 43
43 -
 44
44 -
 45
45 -
 46
46 -
 47
47 -
 48
48 -
 49
49 -
 50
50 -
 51
51 -
 52
52 -
 53
53 -
 54
54 -
 55
55 -
 56
56 -
 57
57 -
 58
58 -
59
-
60
-
61
-
62
-
63
-
64
-
65
-
66
-
67
-
68
-
69
-
70
-
71
-
72
-
73
-
74
-
75
-
76
-
77
-
78
-
79
-
80
-
81
-
82
-
83
-
84
-
85
-
86
-
87
-
88
-
89
-
90
-
91
-
92
-
93
-
94
-
95
-
96
-
97
-
98
-
99
-
100
-
101
-
102
-
103
-
104
 |
 |

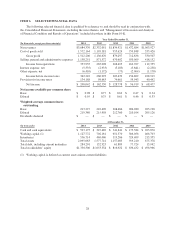
C
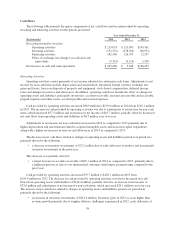
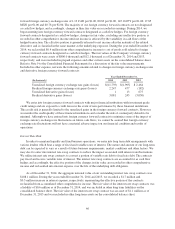
ash Flows
The followin
g
table presents the ma
j
or components of net cash flows used in and provided b
y
operatin
g,
investin
g
and financin
g
activities for the periods presented
:
Year Ended December
31,
(In thousands
)
2014
2013
2012
N
et cas
h
prov
id
e
dby
(use
di
n):
O
peratin
g
activities $ 219,033 $ 120,070 $199,76
1
Investin
g
activities (152,312) (238,102) (46,931)
Financin
g
activities 182,306 126,795 12,297
E
ff
ect o
f
exc
h
an
g
e rate c
h
an
g
es on cas
h
an
d
cas
h
e
q
uivalents (3,341) (3,115) 1,330
N
et increase in cash and cash e
q
uivalents
$
245,686
$
5,648
$
166,457
Operatin
gA
ctivitie
s
Operating activities consist primarily of net income adjusted for certain non-cash items. Adjustments to ne
t
income for non-cash items include depreciation and amortization, unrealized foreign currency exchange rat
e
gains and losses, losses on disposals of property and equipment, stock-based compensation, deferred income
taxes and changes in reserves and allowances. In addition, operating cash flows include the effect of changes i
n
o
perating assets and liabilities, principally inventories, accounts receivable, income taxes payable and receivable,
p
repaid expenses and other assets, accounts payable and accrued expenses.
Cash provided by operating activities increased
$
98.9 million to
$
219.0 million in 2014 from
$
120.1 million
in 2013. The increase in cash provided by operating activities was due to adjustments to net income for non-cash
items, which increased
$
57.5 million and an increase in net income of
$
45.7 million, partially offset by decreased
net cash flows from operating assets and liabilities of
$
4.3 million year over year
.
A
djustments to net income for non-cash items increased in 2014 as compared to 2013 primarily due to
higher depreciation and amortization related to acquired intangible assets and increased capital expenditure
,
along with a higher net increase in reserves and allowances in 2014 as compared to 2013
.
The decrease in net cash flows related to changes in operating assets and liabilities period over period was
p
rimarily driven by the following:
•
a decrease in inventor
y
investments of $72.2 million due to earl
y
deliveries of product and incremental
i
nventor
y
investments in the prior
y
ear.
This decrease was partiall
y
offset b
y
:
•
a lar
g
er increase in accounts receivable of $65.1 million in 2014 as compared to 2013, primaril
y
due to
a high
er proport
i
on o
f
sa
l
es to our
i
nternat
i
ona
l
customers w
i
t
hl
on
g
er pa
y
ment terms compare
d
to t
he
p
r
i
or
y
ear.
Cash provided b
y
operatin
g
activities decreased $79.7 million to $120.1 million in 2013 fro
m
$
199.8 million in 2012. The decrease in cash provided b
y
operatin
g
activities was due to decreased net cash
f
lows from operatin
g
assets and liabilities of $142.4 million, partiall
y
offset b
y
an increase in net income of
$
33.6 million and ad
j
ustments to net income for non-cash items, which increased $29.1 million
y
ear over
y
ear
.
Th
e
i
ncrease
i
n net cas
hfl
ows re
l
ate
d
to c
h
an
g
es
i
n operat
i
n
g
assets an
dli
a
bili
t
i
es per
i
o
d
over per
i
o
d
was
p
r
i
mar
ily d
r
i
ven
by
t
h
e
f
o
ll
ow
i
n
g
:
•
an increase in inventory investments of
$
161.6 million. Inventory grew in 2013 at a rate higher than
r
evenue growth primarily due to supplier delivery challenges experienced in 2012, early deliveries of
38