Under Armour 2014 Annual Report Download - page 37
Download and view the complete annual report
Please find page 37 of the 2014 Under Armour annual report below. You can navigate through the pages in the report by either clicking on the pages listed below, or by using the keyword search tool below to find specific information within the annual report.-
 1
1 -
2
-
3
-
4
-
5
-
6
-
7
-
8
-
9
-
10
-
11
-
12
-
13
-
14
-
15
-
16
-
17
-
18
-
19
-
20
-
21
-
22
-
23
-
24
-
25
-
26
-
 27
27 -
 28
28 -
 29
29 -
 30
30 -
 31
31 -
 32
32 -
 33
33 -
 34
34 -
 35
35 -
 36
36 -
 37
37 -
 38
38 -
 39
39 -
 40
40 -
 41
41 -
 42
42 -
 43
43 -
 44
44 -
 45
45 -
 46
46 -
 47
47 -
48
-
49
-
50
-
51
-
52
-
53
-
54
-
55
-
56
-
57
-
58
-
59
-
60
-
61
-
62
-
63
-
64
-
65
-
66
-
67
-
68
-
69
-
70
-
71
-
72
-
73
-
74
-
75
-
76
-
77
-
78
-
79
-
80
-
81
-
82
-
83
-
84
-
85
-
86
-
87
-
88
-
89
-
90
-
91
-
92
-
93
-
94
-
95
-
96
-
97
-
98
-
99
-
100
-
101
-
102
-
103
-
104
 |
 |

S
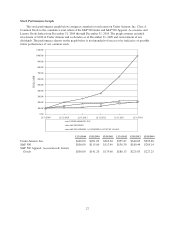
tock Performance Gra
ph
The stock performance graph below compares cumulative total return on Under Armour, Inc. Class
A
Common Stock to the cumulative total return of the S&P
5
00 Index and S&P
5
00 A
pp
arel, Accessories and
Luxury Goods Index from December 31, 2009 through December 31, 2014. The graph assumes an initia
l
investment of
$
100 in Under Armour and each index as of December 31, 2009 and reinvestment of any
dividends. The performance shown on the graph below is not intended to forecast or be indicative of possible
f
uture
p
erformance of our common stock
.
0
.
00
1
00.00
2
00.00
300
.
00
400
.
00
500.00
700.00
900
.
00
1100
.
00
1000
.
00
800.00
600.00
DO
LLAR
S
UNDER ARMOUR
,
INC.
S&P 500 INDEX
S&
P 500
A
PP
A
REL,
ACC
E
SSO
RIE
S
&
LUXURY
GOO
D
S
12/31/2009 12/31/2010 12/31/2011 12/31/2012 12/31/2013 12/31/201
4
12
/
31
/
200
9
12
/
31
/
2010
1
2
/
31
/
2011 12
/
31
/
2012 12
/
31
/
2013
1
2
/
31
/
201
4
U
nder Armour, Inc. $100.00 $201.03 $263.20 $355.87 $640.03 $995.60
S&P 500 $100.00 $115.06 $117.49 $136.30 $180.44 $205.1
4
S&P 500 Apparel, Accessories & Luxur
y
G
oods $100.00 $141.20 $175.60 $180.13 $225.03 $227.25
2
7