Under Armour 2014 Annual Report Download - page 14
Download and view the complete annual report
Please find page 14 of the 2014 Under Armour annual report below. You can navigate through the pages in the report by either clicking on the pages listed below, or by using the keyword search tool below to find specific information within the annual report.-
 1
1 -
2
-
3
-
 4
4 -
 5
5 -
 6
6 -
 7
7 -
 8
8 -
 9
9 -
 10
10 -
 11
11 -
 12
12 -
 13
13 -
 14
14 -
 15
15 -
 16
16 -
 17
17 -
 18
18 -
 19
19 -
 20
20 -
 21
21 -
 22
22 -
 23
23 -
 24
24 -
25
-
26
-
27
-
28
-
29
-
30
-
31
-
32
-
33
-
34
-
35
-
36
-
37
-
38
-
39
-
40
-
41
-
42
-
43
-
44
-
45
-
46
-
47
-
48
-
49
-
50
-
51
-
52
-
53
-
54
-
55
-
56
-
57
-
58
-
59
-
60
-
61
-
62
-
63
-
64
-
65
-
66
-
67
-
68
-
69
-
70
-
71
-
72
-
73
-
74
-
75
-
76
-
77
-
78
-
79
-
80
-
81
-
82
-
83
-
84
-
85
-
86
-
87
-
88
-
89
-
90
-
91
-
92
-
93
-
94
-
95
-
96
-
97
-
98
-
99
-
100
-
101
-
102
-
103
-
104
 |
 |

departments and leagues and teams. In addition, we sell our products to independent distributors in various
countries where we generally do not have direct sales operations and through licensees.
We also sell our products directly to consumers through our own network of brand and factory house store
s
in our North America, Latin America and Asia-Pacific operating segments, and through websites globally. These
f
actory house stores serve an important role in our overall inventory management by allowing us to sell a
significant portion of excess, discontinued and out-of-season products while maintaining the pricing integrity o
f
o
ur brand in our other distribution channels. Through our brand house stores, consumers experience our bran
d
f
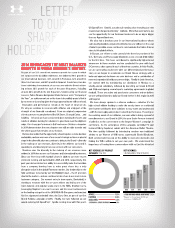
irst-hand and have broader access to our performance products. In 2014, sales through our wholesale, direct to
consumer and licensing channels represented
6
7%, 30% and 3% of net revenues, respectively.
We believe the trend toward performance products is global and plan to continue to introduce our product
s
and simple merchandising story to athletes throughout the world. We are introducing our performance apparel,
f
ootwear and accessories outside of North America in a manner consistent with our past brand-building strategy,
including selling our products directly to teams and individual athletes in these markets, thereby providing u
s
with
p
roduct ex
p
osure to broad audiences of
p
otential consumers
.
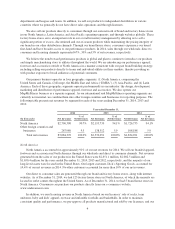
Our primary business operates in four geographic segments: (1) North America, comprising the
U
nited States and Canada, (2) Euro
p
e, the Middle East and Africa (“EMEA”), (3) Asia-Pacific, and (4) Lati
n
America. Each of these geographic segments operate predominantly in one industry: the design, development,
marketing and distribution of performance apparel, footwear and accessories. We also operate our
MapMyFitness business as a separate segment. As our international and MapMyFitness operating segments ar
e
currently not material, we combine them into other foreign countries and businesses for reporting purposes. The
f
ollowing table presents net revenues by segment for each of the years ending December 31, 2014, 2013 an
d
2012
:
Y
ear ended December 31
,
20
1
4
2013 2
0
12
(
In thousands
)
N
et
R
evenue
s
%o
f
N
et
R
evenues
N
et
R
evenues
%of
N
et
R
evenue
s
N
et
R
evenues
%
o
f
N
et
R
evenues
North America $2,796,390 90.7% $2,193,739 94.1% $1,726,733 94.1%
Ot
h
er
f
ore
ig
n countr
i
es an
d
businesses 287,980 9.3 138,312 5.9 108,188 5.
9
Total net revenues
$
3,084,370 100.0%
$
2,332,051 100.0%
$
1,834,921 100.0%
Nort
h
Americ
a
N
ort
h
Amer
i
ca accounte
df
or approx
i
mate
l
y 91% o
f
our net revenues
f
or 2014. We se
ll
our
b
ran
d
e
d
appare
l
,
f
ootwear an
d
accessor
i
es
i
n Nort
h
Amer
i
ca t
h
rou
gh
our w
h
o
l
esa
l
ean
ddi
rect to consumer c
h
anne
l
s. Net revenue
s
generated from the sales of our products in the United States were
$
2,651.1 million,
$
2,082.5 million an
d
$
1,650.4 million for the years ended December 31, 2014, 2013 and 2012, respectively, and the majority of ou
r
l
ong-
li
ve
d
assets were
l
ocate
di
nt
h
eUn
i
te
d
States. Our
l
argest customer, D
i
c
k
’s Sport
i
ng Goo
d
s, accounte
df
o
r
14.4% o
f
our net revenues
i
n 2014. No ot
h
er customers accounte
df
or more t
h
an 10% o
f
our net revenues
.
Our
di
rect to consumer sa
l
es are generate
d
t
h
roug
h
our
b
ran
d
an
df
actory
h
ouse stores, a
l
ong w
i
t
hi
nternet
websites. As of December 31, 2014, we had 125 factory house stores in North America, of which the majority ar
e
located in outlet centers throughout the United States. As of December 31, 2014, we had 5 brand house stores in
Nort
h
Amer
i
ca. Consumers can purc
h
ase our pro
d
ucts
di
rect
l
y
f
rom our e-commerce we
b
s
i
te,
www
.un
d
erarmour.com.
I
na
ddi
t
i
on, we earn
li
cens
i
n
g
revenue
i
n Nort
h
Amer
i
ca
b
ase
d
on our
li
censees’ sa
l
eo
f
soc
k
s, tea
m
un
if
orms,
b
a
by
an
d kid
s’ appare
l
,e
y
ewear an
di
n
fl
ata
bl
e
f
oot
b
a
ll
san
db
as
k
et
b
a
ll
s. In or
d
er to ma
i
nta
in
cons
i
stent qua
li
t
y
an
d
per
f
ormance, we pre-approve a
ll
pro
d
ucts manu
f
acture
d
an
d
so
ld by
our
li
censees, an
d
our
4