Under Armour 2014 Annual Report Download - page 40
Download and view the complete annual report
Please find page 40 of the 2014 Under Armour annual report below. You can navigate through the pages in the report by either clicking on the pages listed below, or by using the keyword search tool below to find specific information within the annual report.-
 1
1 -
2
-
3
-
4
-
5
-
6
-
7
-
8
-
9
-
10
-
11
-
12
-
13
-
14
-
15
-
16
-
17
-
18
-
19
-
20
-
21
-
22
-
23
-
24
-
25
-
26
-
27
-
28
-
29
-
 30
30 -
 31
31 -
 32
32 -
 33
33 -
 34
34 -
 35
35 -
 36
36 -
 37
37 -
 38
38 -
 39
39 -
 40
40 -
 41
41 -
 42
42 -
 43
43 -
 44
44 -
 45
45 -
 46
46 -
 47
47 -
 48
48 -
 49
49 -
 50
50 -
51
-
52
-
53
-
54
-
55
-
56
-
57
-
58
-
59
-
60
-
61
-
62
-
63
-
64
-
65
-
66
-
67
-
68
-
69
-
70
-
71
-
72
-
73
-
74
-
75
-
76
-
77
-
78
-
79
-
80
-
81
-
82
-
83
-
84
-
85
-
86
-
87
-
88
-
89
-
90
-
91
-
92
-
93
-
94
-
95
-
96
-
97
-
98
-
99
-
100
-
101
-
102
-
103
-
104
 |
 |
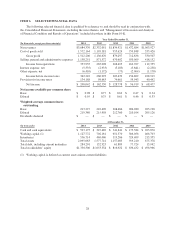
third-party suppliers and manufacturers outside the U.S. to provide fabrics and to produce our products, an
d
disruptions to our supply chain could harm our business. For a more complete discussion of the risks facing ou
r
business, refer to the “Risk Factors” section included in Item 1A
.
G
enera
l
N
et revenues com
p
rise both net sales and license and other revenues. Net sales com
p
rise sales from our
p
rimary product categories, which are apparel, footwear and accessories. Our license and other revenues
p
rimarily consist of fees paid to us by our licensees in exchange for the use of our trademarks on core products of
socks, team uniforms, baby and kids’ apparel, eyewear, inflatable footballs and basketballs, the distribution of
o
ur products in Japan, and revenues associated with our MapMyFitness business.
Cost of goods sold consists primarily of product costs, inbound freight and duty costs, outbound freight
costs, handling costs to make products floor-ready to customer specifications, royalty payments to endorsers
based on a predetermined percentage of sales of selected products and write downs for inventory obsolescence.
T
he fabrics in many of our products are made primarily of petroleum-based synthetic materials. Therefore ou
r
p
roduct costs, as well as our inbound and outbound freight costs, could be affected by long term pricing trends o
f
o
il. In general, as a percentage of net revenues, we expect cost of goods sold associated with our apparel an
d
accessories to be lower than that of our footwear. A limited portion of cost of goods sold is associated wit
h
license and other revenues, primarily website hosting and other costs related to our MapMyFitness business
.
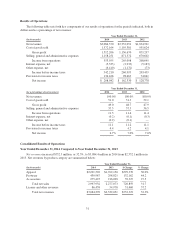
We include outbound freight costs associated with shipping goods to customers as cost of goods sold
;
however, we include the majority of outbound handling costs as a component of selling, general and
administrative expenses. As a result, our gross profit may not be comparable to that of other companies that
include outbound handling costs in their cost of goods sold. Outbound handling costs include costs associate
d
with preparing goods to ship to customers and certain costs to operate our distribution facilities. These costs wer
e
$
55.3 million,
$
46.1 million and
$
34.8 million for the years ended December 31, 2014, 2013 and 2012,
r
espectively.
Our selling, general and administrative expenses consist of costs related to marketing, selling, product
innovation and supply chain and corporate services. Personnel costs are included in these categories based on th
e
employees’ function. Personnel costs include salaries, benefits, incentives and stock-based compensation relate
d
to our employees. Our marketing costs are an important driver of our growth. Marketing costs consist primarily
o
f commercials, print ads, league, team, player and event sponsorships and depreciation expense specific to our
in-store fixture program for our concept shops. Selling costs consist primarily of costs relating to sales through
o
ur wholesale channel, commissions paid to third parties and the majority of our direct to consumer sales channel
costs, including the cost of brand and factory house store leases. Product innovation and supply chain cost
s
include develo
p
ment and innovation costs associated with our a
pp
arel, footwear and accessories
p
roducts and ou
r
MapMyFitness business, along with our sourcing and distribution facility operating costs, and costs relating t
o
o
ur Hong Kong and Guangzhou, China offices which help support product development, manufacturing, quality
assurance and sourcing efforts. Corporate services primarily consist of corporate facility operating costs and
company-wide administrative expenses.
Other expense, net consists of unrealized and realized gains and losses on our foreign currency derivativ
e
f
inancial instruments and unrealized and realized gains and losses on adjustments that arise from fluctuations in
f
oreign currency exchange rates relating to transactions generated by our international subsidiaries.
30