Under Armour 2014 Annual Report Download - page 44
Download and view the complete annual report
Please find page 44 of the 2014 Under Armour annual report below. You can navigate through the pages in the report by either clicking on the pages listed below, or by using the keyword search tool below to find specific information within the annual report.-
 1
1 -
2
-
3
-
4
-
5
-
6
-
7
-
8
-
9
-
10
-
11
-
12
-
13
-
14
-
15
-
16
-
17
-
18
-
19
-
20
-
21
-
22
-
23
-
24
-
25
-
26
-
27
-
28
-
29
-
30
-
31
-
32
-
33
-
 34
34 -
 35
35 -
 36
36 -
 37
37 -
 38
38 -
 39
39 -
 40
40 -
 41
41 -
 42
42 -
 43
43 -
 44
44 -
 45
45 -
 46
46 -
 47
47 -
 48
48 -
 49
49 -
 50
50 -
 51
51 -
 52
52 -
 53
53 -
 54
54 -
55
-
56
-
57
-
58
-
59
-
60
-
61
-
62
-
63
-
64
-
65
-
66
-
67
-
68
-
69
-
70
-
71
-
72
-
73
-
74
-
75
-
76
-
77
-
78
-
79
-
80
-
81
-
82
-
83
-
84
-
85
-
86
-
87
-
88
-
89
-
90
-
91
-
92
-
93
-
94
-
95
-
96
-
97
-
98
-
99
-
100
-
101
-
102
-
103
-
104
 |
 |
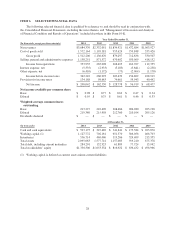
License and other revenues
i
ncreased
$
10.2 million, or 22.8%, to
$
55.0 million in 2013 from
$
44.8 millio
n
in 2012. This increase in license and other revenues was primarily a result of increased distribution and continue
d
unit volume growth by our licensees
.
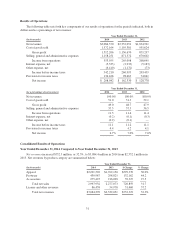
G
ross pro
f
it
i
ncreased
$
257.4 million to
$
1,136.7 million in 2013 from
$
879.3 million in 2012. Gross
p
rofi
t
as a percentage of net revenues, or gross margin, increased 80 basis points to 48.7% in 2013 compared to 47.9
%
in 2012. The increase in gross margin percentage was primarily driven by the following:
•
approximate
6
0 basis point increase driven by sales mix. The sales mix impact was primarily driven by
decreased sales mix of excess inventory through our factory house outlet stores at lower prices, along
with a lower
p
ro
p
ortion of North American wholesale footwear sales.
•
approximate
5
0 basis point increase driven by lower North American apparel and accessories product
i
n
p
ut costs
.
The above increases were partially offset by the below decrease:
•
approximate 20 basis point decrease as a result of higher duty costs on certain products previously
i
mported, which were identified and reserved for during the third quarter of 2013.
Selling, general and administrative expense
s
increased
$
201.0 million to
$
871.6 million in 2013 fro
m
$
670.6 million in 2012. As a percentage of net revenues, selling, general and administrative expenses increase
d
to 37.3% in 2013 from 36.
5
% in 2012. These changes were primarily attributable to the following
:
•
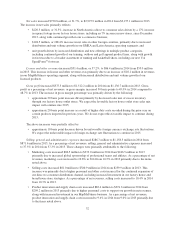
Marketing costs increased
$
41.1 million to
$
246.5 million in 2013 from
$
205.4 million in 201
2
primarily due to increased sponsorship of collegiate and professional teams and athletes and marketin
g
t
o support our international expansion. As a percentage of net revenues, marketing costs decreased to
10.
5
% in 2013 from 11.2% in 2012
.
•
Selling costs increased
$
63.9 million to
$
239.9 million in 2013 from
$
176.0 million in 2012. This
i
ncrease was primarily due to higher personnel and other costs incurred primarily for the continue
d
e
xpansion of our direct to consumer distribution channel. As a percentage of net revenues, selling cost
s
i
ncreased to 10.3% in 2013 from
9
.
6
% in 2012
.
•
Product innovation and supply chain costs increased
$
50.7 million to
$
209.2 million in 2013 fro
m
$
158.5 million in 2012 primarily due to higher incentive compensation as well as higher personnel
c
osts to support our growth in net revenues. As a percentage of net revenues, product innovation and
supply chain costs increased to 9.0% in 2013 from 8.
6
% in 2012
.
•
Cor
p
orate services costs increased
$
45.3 million to
$
176.0 million in 2013 from
$
130.7 million in
2012. This increase was primarily attributable to higher incentive compensation as well as higher
c
orporate personnel costs necessary to support our growth. As a percentage of net revenues, corporate
services costs increased to 7.
5
% in 2013 from 7.1% in 2012.
Income from operation
s
increased
$
56.4 million, or 27.0%, to
$
265.1 million in 2013 from
$
208.7 million in
2012. Income from operations as a percentage of net revenues was unchanged at 11.4% in 2013 and 2012.
Interest ex
p
ense, ne
t
d
ecreased
$
2.3 million to
$
2.9 million in 2013 from
$
5.2 million in 2012. This
decrease was primarily due to the refinancing in December 2012 of the debt assumed in connection with the
ac
q
uisition of our cor
p
orate head
q
uarters.
O
ther ex
p
ense, ne
t
i
ncreased
$
1.1 million to
$
1.2 million in 2013 from
$
0.1 million in 2012. This increas
e
was due to higher net losses in 2013 on the combined foreign currency exchange rate changes on transaction
s
denominated in foreign currencies and our foreign currency derivative financial instruments as compared t
o
2012.
34