Under Armour 2014 Annual Report Download - page 45
Download and view the complete annual report
Please find page 45 of the 2014 Under Armour annual report below. You can navigate through the pages in the report by either clicking on the pages listed below, or by using the keyword search tool below to find specific information within the annual report.-
 1
1 -
2
-
3
-
4
-
5
-
6
-
7
-
8
-
9
-
10
-
11
-
12
-
13
-
14
-
15
-
16
-
17
-
18
-
19
-
20
-
21
-
22
-
23
-
24
-
25
-
26
-
27
-
28
-
29
-
30
-
31
-
32
-
33
-
34
-
 35
35 -
 36
36 -
 37
37 -
 38
38 -
 39
39 -
 40
40 -
 41
41 -
 42
42 -
 43
43 -
 44
44 -
 45
45 -
 46
46 -
 47
47 -
 48
48 -
 49
49 -
 50
50 -
 51
51 -
 52
52 -
 53
53 -
 54
54 -
 55
55 -
56
-
57
-
58
-
59
-
60
-
61
-
62
-
63
-
64
-
65
-
66
-
67
-
68
-
69
-
70
-
71
-
72
-
73
-
74
-
75
-
76
-
77
-
78
-
79
-
80
-
81
-
82
-
83
-
84
-
85
-
86
-
87
-
88
-
89
-
90
-
91
-
92
-
93
-
94
-
95
-
96
-
97
-
98
-
99
-
100
-
101
-
102
-
103
-
104
 |
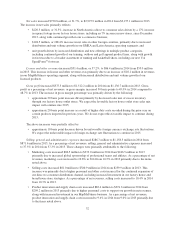
 |

P
rovision
f
or income taxe
s
i
ncreased
$
24.0 million to
$
98.7 million in 2013 from
$
74.7 million in 2012. Ou
r
effective tax rate was 37.8% in 2013 compared to 3
6
.7% in 2012. Our effective tax rate for 2013 was higher than
the effective tax rate for 2012 primarily due to increased foreign investments driving a lower proportion o
f
f
oreign taxable income, along with increased non-deductible expenses, including acquisition related expenses, i
n
2013
.
S
e
g
ment Results of Operation
s
T
h
e net revenues an
d
operat
i
n
gi
ncome (
l
oss) assoc
i
ate
d
w
i
t
h
our se
g
ments are summar
i
ze
di
nt
h
e
f
o
ll
ow
i
n
g
ta
bl
es. T
h
ema
j
or
i
t
y
o
f
corporate expenses w
i
t
hi
n Nort
h
Amer
i
ca
h
ave not
b
een a
ll
ocate
d
to ot
h
er
f
ore
ign
countr
i
es an
db
us
i
nesses
.
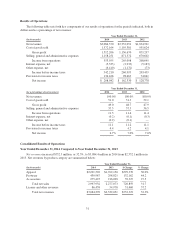
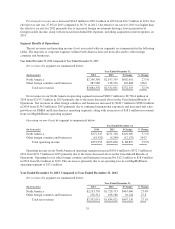
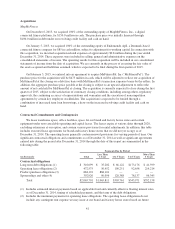
Year Ended December 31, 2014 Compared to Year Ended December 31, 2013
Net revenue
s
by segment are summarized below
:
Year Ended December
31,
(In thousands
)
2014
2013
$ Chang
e
%
Chang
e
N
orth America $2,796,390 $2,193,739 $602,651 27.5
%
Other forei
g
n countries and businesses 287,980 138,312 149,
66
8 108.2
T
otal net revenues
$
3,084,370
$
2,332,051
$
752,319 32.3%
N
et revenues in our North American operatin
g
se
g
ment increased $602.7 million to $2,796.4 million i
n
2014 from $2,193.7 million in 2013 primaril
y
due to the items discussed above in the Consolidated Results o
f
Operations. Net revenues in other forei
g
n countries and businesses increased b
y
$149.7 million to $288.0 millio
n
in 2014 from $138.3 million in 2013 primaril
y
due to continued international expansion and increased unit sale
s
g
rowth in our EMEA and Latin America operatin
g
se
g
ments, alon
g
with an increase of $18.1 million in revenue
s
f
rom our MapM
y
F
i
tness operat
i
n
g
se
g
ment
.
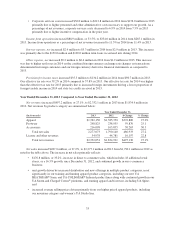
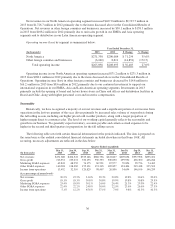
O
perating income (
l
oss)
b
y segment
i
s summar
i
ze
db
e
l
ow:
Year Ended December
31
,
(In t
h
ousan
d
s
)
2014
2013
$
Chang
e
% Chang
e
N
orth America
$
372,347
$
271,338
$
101,009 37.2%
Other foreign countries and businesses (18,392) (6,240) (12,1
5
2) 194.7
T
otal operating income
$
353,955
$
265,098
$
88,857 33.5%
Operating income in our North American operating segment increased
$
101.0 million to
$
372.3 million in
2014 from
$
271.3 million in 2013 primarily due to the items discussed above in the Consolidated Results o
f
Operations. Operating loss in other foreign countries and businesses increased by
$
12.2 million to
$
18.4 millio
n
in 2014 from
$
6.2 million in 2013. This increase is primarily due to an operating loss in our MapMyFitnes
s
o
perating segment of
$
13.1 million.
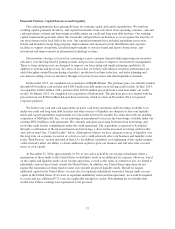
Year Ended December 31, 2013 Compared to Year Ended December 31, 201
2
Net revenue
s
b
y
se
g
ment are summarized below
:
Year Ended December 31,
(
In thousands
)
201
3
201
2
$ Chan
ge
%
Chan
ge
N
orth America $2
,
193
,
739 $1
,
726
,
733 $467
,
006 27.0%
Ot
h
er
f
ore
ig
n countr
i
es an
db
us
i
nesses 138,312 108,188 30,124 27.
8
T
otal net revenues $2,332,051 $1,834,921 $497,130 27.1
%
35