U-Haul 2004 Annual Report Download - page 77
Download and view the complete annual report
Please find page 77 of the 2004 U-Haul annual report below. You can navigate through the pages in the report by either clicking on the pages listed below, or by using the keyword search tool below to find specific information within the annual report.
AMERCO AND CONSOLIDATED ENTITIES
NOTES TO CONSOLIDATED FINANCIAL STATEMENTS Ì (Continued)
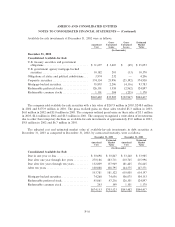
Available-for-sale investments at December 31, 2002 were as follows:
Gross Gross Estimated
Amortized Unrealized Unrealized Market
Cost Gains Losses Value
(In thousands)
December 31, 2002
Consolidated Available-for-Sale
U.S. treasury securities and government
obligations ÏÏÏÏÏÏÏÏÏÏÏÏÏÏÏÏÏÏÏÏÏÏÏÏÏÏÏÏÏÏÏ $ 31,697 $ 3,405 $ (49) $ 35,053
U.S. government agency mortgage-backed
securities ÏÏÏÏÏÏÏÏÏÏÏÏÏÏÏÏÏÏÏÏÏÏÏÏÏÏÏÏÏÏÏÏ 10,182 201 (13) 10,370
Obligations of states and political subdivisions ÏÏÏ 3,974 232 Ì 4,206
Corporate securities ÏÏÏÏÏÏÏÏÏÏÏÏÏÏÏÏÏÏÏÏÏÏÏÏÏ 574,334 25,996 (25,392) 574,938
Mortgage-backed securitiesÏÏÏÏÏÏÏÏÏÏÏÏÏÏÏÏÏÏÏ 95,893 2,206 (4,316) 93,783
Redeemable preferred stocks ÏÏÏÏÏÏÏÏÏÏÏÏÏÏÏÏÏ 126,301 1,558 (2,962) 124,897
Redeemable common stocksÏÏÏÏÏÏÏÏÏÏÏÏÏÏÏÏÏÏ 1,101 304 (235) 1,170
$843,482 $33,902 $(32,967) $844,417
The company sold available-for-sale securities with a fair value of $267.9 million in 2003, $248.0 million
in 2002 and $175.9 million in 2001. The gross realized gains on these sales totaled $5.3 million in 2003,
$6.0 million in 2002 and $3.8 million in 2001. The company realized gross losses on these sales of $3.1 million
in 2003, $2.4 million in 2002 and $0.3 million in 2001. The company recognized a write-down of investments
due to other than temporary declines on available-for-sale investments of approximately $5.0 million in 2003,
$9.8 million in 2002 and $6.7 million in 2001.
The adjusted cost and estimated market value of available-for-sale investments in debt securities at
December 31, 2003 as compared to December 31, 2002, by contractual maturity, were as follows:
December 31, 2003 December 31, 2002
Estimated Estimated
Amortized Market Amortized Market
Cost Value Cost Value
(In thousands)
Consolidated Available-for-Sale
Due in one year or less ÏÏÏÏÏÏÏÏÏÏÏÏÏÏÏÏÏÏÏÏÏÏ $ 50,698 $ 50,847 $ 53,240 $ 53,985
Due after one year through Ñve years ÏÏÏÏÏÏÏÏÏÏ 270,186 283,711 210,765 215,996
Due after Ñve years through ten yearsÏÏÏÏÏÏÏÏÏÏ 132,009 137,969 181,425 176,645
After ten years ÏÏÏÏÏÏÏÏÏÏÏÏÏÏÏÏÏÏÏÏÏÏÏÏÏÏÏÏÏ 100,888 108,795 164,575 167,571
553,781 581,322 610,005 614,197
Mortgage-backed securitiesÏÏÏÏÏÏÏÏÏÏÏÏÏÏÏÏÏÏÏ 74,268 74,636 106,075 104,153
Redeemable preferred stock ÏÏÏÏÏÏÏÏÏÏÏÏÏÏÏÏÏÏ 45,861 47,216 126,301 124,897
Redeemable common stock ÏÏÏÏÏÏÏÏÏÏÏÏÏÏÏÏÏÏ 243 349 1,101 1,170
$674,153 $703,523 $843,482 $844,417
F-16


