U-Haul 2004 Annual Report Download - page 35
Download and view the complete annual report
Please find page 35 of the 2004 U-Haul annual report below. You can navigate through the pages in the report by either clicking on the pages listed below, or by using the keyword search tool below to find specific information within the annual report.-
 1
1 -
2
-
3
-
4
-
5
-
6
-
7
-
8
-
9
-
10
-
11
-
12
-
13
-
14
-
15
-
16
-
17
-
18
-
19
-
20
-
21
-
22
-
23
-
24
-
 25
25 -
 26
26 -
 27
27 -
 28
28 -
 29
29 -
 30
30 -
 31
31 -
 32
32 -
 33
33 -
 34
34 -
 35
35 -
 36
36 -
 37
37 -
 38
38 -
 39
39 -
 40
40 -
 41
41 -
 42
42 -
 43
43 -
 44
44 -
 45
45 -
46
-
47
-
48
-
49
-
50
-
51
-
52
-
53
-
54
-
55
-
56
-
57
-
58
-
59
-
60
-
61
-
62
-
63
-
64
-
65
-
66
-
67
-
68
-
69
-
70
-
71
-
72
-
73
-
74
-
75
-
76
-
77
-
78
-
79
-
80
-
81
-
82
-
83
-
84
-
85
-
86
-
87
-
88
-
89
-
90
-
91
-
92
-
93
-
94
-
95
-
96
-
97
-
98
-
99
-
100
-
101
-
102
-
103
-
104
-
105
-
106
-
107
-
108
-
109
-
110
-
111
-
112
-
113
-
114
-
115
-
116
-
117
-
118
-
119
-
120
-
121
-
122
-
123
-
124
-
125
 |
 |
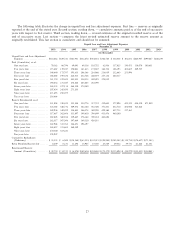
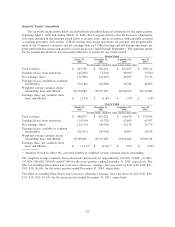
Cash Provided from Operating Activities by Operating Segments
Moving and Self-Storage
Cash provided from operating activities from U-Haul was $210.9 million, $83.5 million and $96.2 million
in Ñscal years 2004, 2003 and 2002, respectively. The decrease in Ñscal year 2003 was due to a decline in
intercompany payables that was partially oÅset by an increase in depreciation expense of rental equipment.
Cash provided (used) from operating activities for Real Estate was $93.8 million, $(87.1) million and
$(144.1) million for Ñscal years 2004, 2003 and 2002, respectively. Cash provided (used) from operating
activities for SAC Holdings was $8.2 million, $13.5 million and $(1.3) million in Ñscal years 2004, 2003 and
2002, respectively.
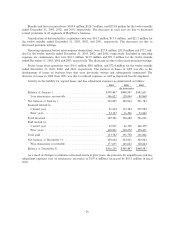
Life Insurance
Cash provided (used) from operating activities from Oxford was $20.9 million, $(18.0) million and
$(5.2) million for Ñscal years 2004, 2003 and 2002, respectively. The increase in cash Öow from operating
activities from Ñscal years 2003 and 2002 relates to lower federal income tax payments, better loss experience
and lower commissions.
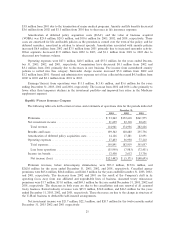
Property and Casualty Insurance
Cash Öows used by operating activities were $86.8 million, $75.1 million, and $61.5 million for the years
ended December 31, 2003, 2002, and 2001, respectively. The cash used by operating activities is a result of
RepWest exiting the assumed reinsurance and non U-Haul related lines. As RepWest adjudicates the claims
in these lines there will be a continued use of cash and a corresponding decrease in insurance reserves.
Liquidity and Capital Resources Ì Summary
We believe we have the Ñnancial resources needed to meet our business requirements including capital
expenditures for the expansion and modernization of our rental Öeet, rental equipment and rental storage
space, working capital requirements and our preferred stock dividend program.
For a more detailed discussion of our long-term debt and borrowing capacity, please see footnote 9
""Borrowings'' to the ""Notes to the Consolidated Financial Statements.''
30