U-Haul 2004 Annual Report Download - page 67
Download and view the complete annual report
Please find page 67 of the 2004 U-Haul annual report below. You can navigate through the pages in the report by either clicking on the pages listed below, or by using the keyword search tool below to find specific information within the annual report.-
 1
1 -
2
-
3
-
4
-
5
-
6
-
7
-
8
-
9
-
10
-
11
-
12
-
13
-
14
-
15
-
16
-
17
-
18
-
19
-
20
-
21
-
22
-
23
-
24
-
25
-
26
-
27
-
28
-
29
-
30
-
31
-
32
-
33
-
34
-
35
-
36
-
37
-
38
-
39
-
40
-
41
-
42
-
43
-
44
-
45
-
46
-
47
-
48
-
49
-
50
-
51
-
52
-
53
-
54
-
55
-
56
-
 57
57 -
 58
58 -
 59
59 -
 60
60 -
 61
61 -
 62
62 -
 63
63 -
 64
64 -
 65
65 -
 66
66 -
 67
67 -
 68
68 -
 69
69 -
 70
70 -
 71
71 -
 72
72 -
 73
73 -
 74
74 -
 75
75 -
 76
76 -
 77
77 -
78
-
79
-
80
-
81
-
82
-
83
-
84
-
85
-
86
-
87
-
88
-
89
-
90
-
91
-
92
-
93
-
94
-
95
-
96
-
97
-
98
-
99
-
100
-
101
-
102
-
103
-
104
-
105
-
106
-
107
-
108
-
109
-
110
-
111
-
112
-
113
-
114
-
115
-
116
-
117
-
118
-
119
-
120
-
121
-
122
-
123
-
124
-
125
 |
 |

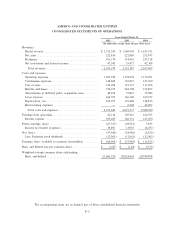
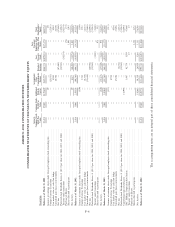
AMERCO AND CONSOLIDATED ENTITIES
CONSOLIDATED STATEMENTS OF CASH FLOWS
Year Ended March 31,
2004 2003 2002
(In thousands)
Cash Öows from operating activities:
Net/(loss) ÏÏÏÏÏÏÏÏÏÏÏÏÏÏÏÏÏÏÏÏÏÏÏÏÏÏÏÏÏÏÏÏÏÏÏÏÏÏÏÏÏÏÏÏÏÏ $ (2,852) $ (24,986) $ (47,440)
Depreciation and amortizationÏÏÏÏÏÏÏÏÏÏÏÏÏÏÏÏÏÏÏÏÏÏÏÏÏÏÏÏÏÏ 190,676 185,833 149,058
Provision for losses on accounts receivable ÏÏÏÏÏÏÏÏÏÏÏÏÏÏÏÏÏÏÏ (377) 3,903 5,682
Net (gain) loss on sale of real and personal property ÏÏÏÏÏÏÏÏÏÏ 3,754 (10,515) (3,526)
(Gain) Loss on sale of investments ÏÏÏÏÏÏÏÏÏÏÏÏÏÏÏÏÏÏÏÏÏÏÏÏÏ (3,112) 9,497 5,923
Changes in policy liabilities and accrualsÏÏÏÏÏÏÏÏÏÏÏÏÏÏÏÏÏÏÏÏÏ (30,714) (78,314) (6,561)
Additions to deferred policy acquisition costs ÏÏÏÏÏÏÏÏÏÏÏÏÏÏÏÏÏ (17,230) (42,663) (39,252)
Net change in other operating assets and liabilities ÏÏÏÏÏÏÏÏÏÏÏÏ (180,470) 31,775 (83,515)
Net cash provided (used) by operating activities ÏÏÏÏÏÏÏÏÏÏÏÏÏÏÏÏ (40,325) 74,530 (19,631)
Cash Öow from investment activities:
Purchase of investments:
Property, plant and equipment ÏÏÏÏÏÏÏÏÏÏÏÏÏÏÏÏÏÏÏÏÏÏÏÏÏÏÏ (198,443) (243,161) (381,483)
Fixed maturities ÏÏÏÏÏÏÏÏÏÏÏÏÏÏÏÏÏÏÏÏÏÏÏÏÏÏÏÏÏÏÏÏÏÏÏÏÏÏÏ (77,384) (278,357) (257,559)
Common stock ÏÏÏÏÏÏÏÏÏÏÏÏÏÏÏÏÏÏÏÏÏÏÏÏÏÏÏÏÏÏÏÏÏÏÏÏÏÏÏÏ (1,736) Ì (418)
Preferred stock ÏÏÏÏÏÏÏÏÏÏÏÏÏÏÏÏÏÏÏÏÏÏÏÏÏÏÏÏÏÏÏÏÏÏÏÏÏÏÏÏ Ì Ì (2,072)
Other asset investment ÏÏÏÏÏÏÏÏÏÏÏÏÏÏÏÏÏÏÏÏÏÏÏÏÏÏÏÏÏÏÏÏÏÏ (174) (1,410) (2,259)
Real estate ÏÏÏÏÏÏÏÏÏÏÏÏÏÏÏÏÏÏÏÏÏÏÏÏÏÏÏÏÏÏÏÏÏÏÏÏÏÏÏÏÏÏÏÏ (17,156) (21,759) 4,277
Mortgage loans ÏÏÏÏÏÏÏÏÏÏÏÏÏÏÏÏÏÏÏÏÏÏÏÏÏÏÏÏÏÏÏÏÏÏÏÏÏÏÏÏ (450) Ì (1,351)
Proceeds from sales of investments:
Property, plant and equipment ÏÏÏÏÏÏÏÏÏÏÏÏÏÏÏÏÏÏÏÏÏÏÏÏÏÏÏ 63,175 96,889 229,375
Fixed maturities ÏÏÏÏÏÏÏÏÏÏÏÏÏÏÏÏÏÏÏÏÏÏÏÏÏÏÏÏÏÏÏÏÏÏÏÏÏÏÏ 243,490 364,114 233,716
Common stock ÏÏÏÏÏÏÏÏÏÏÏÏÏÏÏÏÏÏÏÏÏÏÏÏÏÏÏÏÏÏÏÏÏÏÏÏÏÏÏÏ 3,452 Ì Ì
Preferred stock ÏÏÏÏÏÏÏÏÏÏÏÏÏÏÏÏÏÏÏÏÏÏÏÏÏÏÏÏÏÏÏÏÏÏÏÏÏÏÏÏ 16,882 2,885 4,400
Real estate ÏÏÏÏÏÏÏÏÏÏÏÏÏÏÏÏÏÏÏÏÏÏÏÏÏÏÏÏÏÏÏÏÏÏÏÏÏÏÏÏÏÏÏÏ 6,338 22,043 3,700
Mortgage loans ÏÏÏÏÏÏÏÏÏÏÏÏÏÏÏÏÏÏÏÏÏÏÏÏÏÏÏÏÏÏÏÏÏÏÏÏÏÏÏÏ 16,374 18,173 18,690
Changes in other investments ÏÏÏÏÏÏÏÏÏÏÏÏÏÏÏÏÏÏÏÏÏÏÏÏÏÏÏÏÏÏ 811 4,481 2,897
Net cash provided (used) by investing activities ÏÏÏÏÏÏÏÏÏÏÏÏÏÏÏÏ 55,179 (36,102) (148,087)
Cash Öow from Ñnancing activities:
Net change in short-term borrowings ÏÏÏÏÏÏÏÏÏÏÏÏÏÏÏÏÏÏÏÏÏÏÏÏ 165,041 21,900 (9,277)
Proceeds from notes ÏÏÏÏÏÏÏÏÏÏÏÏÏÏÏÏÏÏÏÏÏÏÏÏÏÏÏÏÏÏÏÏÏÏÏÏÏÏ 831,973 349,836 247,893
Debt issuance costsÏÏÏÏÏÏÏÏÏÏÏÏÏÏÏÏÏÏÏÏÏÏÏÏÏÏÏÏÏÏÏÏÏÏÏÏÏÏÏ (24,831) (3,010) (390)
Leveraged Employee Stock Ownership Plan:
Purchase of shares ÏÏÏÏÏÏÏÏÏÏÏÏÏÏÏÏÏÏÏÏÏÏÏÏÏÏÏÏÏÏÏÏÏÏÏÏÏ Ì Ì (72)
Payments on loans ÏÏÏÏÏÏÏÏÏÏÏÏÏÏÏÏÏÏÏÏÏÏÏÏÏÏÏÏÏÏÏÏÏÏÏÏÏ 1,151 975 1,093
Principal payments on notes ÏÏÏÏÏÏÏÏÏÏÏÏÏÏÏÏÏÏÏÏÏÏÏÏÏÏÏÏÏÏÏ (905,684) (442,112) (107,181)
Preferred stock dividend paid ÏÏÏÏÏÏÏÏÏÏÏÏÏÏÏÏÏÏÏÏÏÏÏÏÏÏÏÏÏÏ (3,241) (6,480) (12,963)
Treasury stock acquisitions, netÏÏÏÏÏÏÏÏÏÏÏÏÏÏÏÏÏÏÏÏÏÏÏÏÏÏÏÏÏ Ì (1,408) (10,154)
Investment contract deposits ÏÏÏÏÏÏÏÏÏÏÏÏÏÏÏÏÏÏÏÏÏÏÏÏÏÏÏÏÏÏÏ 50,990 165,281 150,432
Investment contract withdrawals ÏÏÏÏÏÏÏÏÏÏÏÏÏÏÏÏÏÏÏÏÏÏÏÏÏÏÏÏ (115,530) (98,022) (99,845)
Net cash provided (used) by Ñnancing activities ÏÏÏÏÏÏÏÏÏÏÏÏÏÏÏÏ (131) (13,040) 159,536
Increase (decrease) in cash and cash equivalentsÏÏÏÏÏÏÏÏÏÏÏÏÏÏÏÏ 14,723 25,388 (8,182)
Cash and cash equivalents at beginning of year ÏÏÏÏÏÏÏÏÏÏÏÏÏÏÏÏÏ 66,834 41,446 49,628
Cash and cash equivalents at end of year ÏÏÏÏÏÏÏÏÏÏÏÏÏÏÏÏÏÏÏÏÏÏ $ 81,557 $ 66,834 $ 41,446
The accompanying notes are an integral part of these consolidated Ñnancial statements.
F-6