U-Haul 2004 Annual Report Download - page 23
Download and view the complete annual report
Please find page 23 of the 2004 U-Haul annual report below. You can navigate through the pages in the report by either clicking on the pages listed below, or by using the keyword search tool below to find specific information within the annual report.-
 1
1 -
2
-
3
-
4
-
5
-
6
-
7
-
8
-
9
-
10
-
11
-
12
-
 13
13 -
 14
14 -
 15
15 -
 16
16 -
 17
17 -
 18
18 -
 19
19 -
 20
20 -
 21
21 -
 22
22 -
 23
23 -
 24
24 -
 25
25 -
 26
26 -
 27
27 -
 28
28 -
 29
29 -
 30
30 -
 31
31 -
 32
32 -
 33
33 -
34
-
35
-
36
-
37
-
38
-
39
-
40
-
41
-
42
-
43
-
44
-
45
-
46
-
47
-
48
-
49
-
50
-
51
-
52
-
53
-
54
-
55
-
56
-
57
-
58
-
59
-
60
-
61
-
62
-
63
-
64
-
65
-
66
-
67
-
68
-
69
-
70
-
71
-
72
-
73
-
74
-
75
-
76
-
77
-
78
-
79
-
80
-
81
-
82
-
83
-
84
-
85
-
86
-
87
-
88
-
89
-
90
-
91
-
92
-
93
-
94
-
95
-
96
-
97
-
98
-
99
-
100
-
101
-
102
-
103
-
104
-
105
-
106
-
107
-
108
-
109
-
110
-
111
-
112
-
113
-
114
-
115
-
116
-
117
-
118
-
119
-
120
-
121
-
122
-
123
-
124
-
125
 |
 |

Insurance Reserves
Liabilities for life insurance and certain annuity policies are established to meet the estimated future
obligations of policies in force, and are based on mortality and withdrawal assumptions from recognized
actuarial tables which contain margins for adverse deviation. Liabilities for annuity contracts consist of
contract account balances that accrue to the beneÑt of the policyholders, excluding surrender values.
Liabilities for health, disability and other policies represents estimates of payments to be made on insurance
claims for reported losses and estimates of losses incurred, but not yet reported. Insurance reserves for
RepWest and U-Haul International, Inc. take into account losses incurred based upon actuarial estimates.
These estimates are based on past claims experience and current claim trends as well as social and economic
conditions such as changes in legal theories and inÖation. Due to the nature of underlying risks and the high
degree of uncertainty associated with the determination of the liability for future policy beneÑts and claims,
the amounts to be ultimately paid to settle liabilities cannot be precisely determined and may vary signiÑcantly
from the estimated liability.
Investments
For investments accounted for under SFAS 115, in determining if and when a decline in market value
below amortized cost is other than temporary, quoted market prices, dealer quotes or discounted cash Öows are
reviewed. Other-than-temporary declines in value are recognized in the current period operating results to the
extent of the decline.
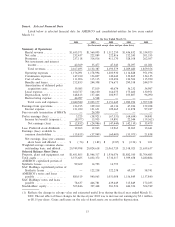
Results of Operations
AMERCO and Consolidated Entities
March 31,
2004 2003 2002
(In thousands)
Rental revenue ÏÏÏÏÏÏÏÏÏÏÏÏÏÏÏÏÏÏÏÏÏÏÏÏÏÏÏÏÏÏÏÏÏÏÏÏÏÏÏÏÏÏÏ $1,655,571 $1,560,005 $1,512,250
Net sales ÏÏÏÏÏÏÏÏÏÏÏÏÏÏÏÏÏÏÏÏÏÏÏÏÏÏÏÏÏÏÏÏÏÏÏÏÏÏÏÏÏÏÏÏÏÏÏÏ 232,437 222,889 222,816
Premiums ÏÏÏÏÏÏÏÏÏÏÏÏÏÏÏÏÏÏÏÏÏÏÏÏÏÏÏÏÏÏÏÏÏÏÏÏÏÏÏÏÏÏÏÏÏÏÏ 237,118 314,016 411,170
Net investment and interest income ÏÏÏÏÏÏÏÏÏÏÏÏÏÏÏÏÏÏÏÏÏÏÏÏÏ 42,369 35,477 47,343
Total RevenuesÏÏÏÏÏÏÏÏÏÏÏÏÏÏÏÏÏÏÏÏÏÏÏÏÏÏÏÏÏÏÏÏÏÏÏÏÏÏÏÏÏÏÏ $2,167,495 $2,132,387 $2,193,579
Operating expenses ÏÏÏÏÏÏÏÏÏÏÏÏÏÏÏÏÏÏÏÏÏÏÏÏÏÏÏÏÏÏÏÏÏÏÏÏÏÏÏ $1,176,091 $1,178,994 $1,203,930
Commission expenses ÏÏÏÏÏÏÏÏÏÏÏÏÏÏÏÏÏÏÏÏÏÏÏÏÏÏÏÏÏÏÏÏÏÏÏÏÏ 147,010 136,827 140,442
Cost of sales ÏÏÏÏÏÏÏÏÏÏÏÏÏÏÏÏÏÏÏÏÏÏÏÏÏÏÏÏÏÏÏÏÏÏÏÏÏÏÏÏÏÏÏÏÏ 111,906 115,115 122,694
BeneÑts and losses ÏÏÏÏÏÏÏÏÏÏÏÏÏÏÏÏÏÏÏÏÏÏÏÏÏÏÏÏÏÏÏÏÏÏÏÏÏÏÏÏ 212,853 244,308 376,673
Amortization of deferred policy acquisition costsÏÏÏÏÏÏÏÏÏÏÏÏÏÏÏ 39,083 37,819 40,674
Lease expenseÏÏÏÏÏÏÏÏÏÏÏÏÏÏÏÏÏÏÏÏÏÏÏÏÏÏÏÏÏÏÏÏÏÏÏÏÏÏÏÏÏÏÏÏ 160,727 166,100 164,075
Depreciation, net(A)ÏÏÏÏÏÏÏÏÏÏÏÏÏÏÏÏÏÏÏÏÏÏÏÏÏÏÏÏÏÏÏÏÏÏÏÏÏÏ 148,813 137,446 102,957
Restructuring expenses ÏÏÏÏÏÏÏÏÏÏÏÏÏÏÏÏÏÏÏÏÏÏÏÏÏÏÏÏÏÏÏÏÏÏÏÏ 44,097 6,568 Ì
Total costs and expenses ÏÏÏÏÏÏÏÏÏÏÏÏÏÏÏÏÏÏÏÏÏÏÏÏÏÏÏÏÏÏÏÏÏÏÏ $2,040,580 $2,023,177 $2,151,445
Earnings from operations ÏÏÏÏÏÏÏÏÏÏÏÏÏÏÏÏÏÏÏÏÏÏÏÏÏÏÏÏÏÏÏÏÏÏ $ 126,915 $ 109,210 $ 42,134
Interest expense ÏÏÏÏÏÏÏÏÏÏÏÏÏÏÏÏÏÏÏÏÏÏÏÏÏÏÏÏÏÏÏÏÏÏÏÏÏÏÏÏÏÏ 121,690 148,131 109,465
Pre-tax earnings (loss) ÏÏÏÏÏÏÏÏÏÏÏÏÏÏÏÏÏÏÏÏÏÏÏÏÏÏÏÏÏÏÏÏÏÏÏÏ 5,225 (38,921) (67,331)
Income tax beneÑt (expense)ÏÏÏÏÏÏÏÏÏÏÏÏÏÏÏÏÏÏÏÏÏÏÏÏÏÏÏÏÏÏÏ (8,077) 13,935 19,891
Net earnings (loss) ÏÏÏÏÏÏÏÏÏÏÏÏÏÏÏÏÏÏÏÏÏÏÏÏÏÏÏÏÏÏÏÏÏÏÏÏÏÏÏ $ (2,852) $ (24,986) $ (47,440)
(A) Depreciation is shown net of (gain)/losses on the disposal of Ñxed assets.
18