U-Haul 2004 Annual Report Download - page 27
Download and view the complete annual report
Please find page 27 of the 2004 U-Haul annual report below. You can navigate through the pages in the report by either clicking on the pages listed below, or by using the keyword search tool below to find specific information within the annual report.-
 1
1 -
2
-
3
-
4
-
5
-
6
-
7
-
8
-
9
-
10
-
11
-
12
-
13
-
14
-
15
-
16
-
 17
17 -
 18
18 -
 19
19 -
 20
20 -
 21
21 -
 22
22 -
 23
23 -
 24
24 -
 25
25 -
 26
26 -
 27
27 -
 28
28 -
 29
29 -
 30
30 -
 31
31 -
 32
32 -
 33
33 -
 34
34 -
 35
35 -
 36
36 -
 37
37 -
38
-
39
-
40
-
41
-
42
-
43
-
44
-
45
-
46
-
47
-
48
-
49
-
50
-
51
-
52
-
53
-
54
-
55
-
56
-
57
-
58
-
59
-
60
-
61
-
62
-
63
-
64
-
65
-
66
-
67
-
68
-
69
-
70
-
71
-
72
-
73
-
74
-
75
-
76
-
77
-
78
-
79
-
80
-
81
-
82
-
83
-
84
-
85
-
86
-
87
-
88
-
89
-
90
-
91
-
92
-
93
-
94
-
95
-
96
-
97
-
98
-
99
-
100
-
101
-
102
-
103
-
104
-
105
-
106
-
107
-
108
-
109
-
110
-
111
-
112
-
113
-
114
-
115
-
116
-
117
-
118
-
119
-
120
-
121
-
122
-
123
-
124
-
125
 |
 |
Moving and Self-Storage
2004 Compared with 2003
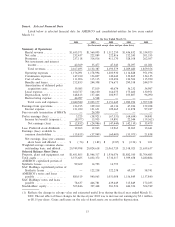
Rental revenues at U-Haul, before consolidating entries, were $1,548.4 million in Ñscal 2004, compared
with $1,433.4 million in 2003. This represents an increase of $115.0 million, or 8.0%, and was driven by a
combination of factors, including increased utilization, better price realization and improved product mix.
Rental revenues at SAC Holdings, before consolidating entries, were $168.4 million in Ñscal 2004 compared
with $168.0 million in 2003. This represents an increase of $0.4 million, or 0.2%, and reÖects a stable number
of rooms available for rent. Rental revenues at Real Estate, before consolidating entries, were $59.8 million in
Ñscal 2004, compared with $59.2 million in 2003. This represents an increase of $0.6 million, or 1.0%, and
reÖects increased rental rates.
Net sales of moving and self-storage related products and services at U-Haul were $181.8 million in Ñscal
2004, compared with $174.1 million in 2003. This represents an increase of $7.7 million, or 4.4%, and was
driven by increased volume and improved pricing. Net sales of moving and self-storage related products and
services at SAC Holdings were $50.6 million in Ñscal 2004, compared with $48.8 million in 2003. This
represents an increase of $1.8 million, or 3.7%, and was driven by increased volume and improved pricing.
Net investment and interest income at U-Haul, before consolidating entries, was $21.5 million in Ñscal
2004, compared with $29.4 million in 2003. The decrease in interest income is directly related to lower average
investment balances in SAC Holdings notes. Net investment and interest income at Real Estate, before
consolidating entries, was $16.1 million in Ñscal 2004, compared with $10.7 million in 2003. The increase in
interest income is directly related to increased investments in mortgage notes.
Operating expenses at U-Haul, before consolidating entries, were $1,062.7 million in Ñscal 2004,
compared with $1,029.8 million in 2003. This represents an increase of $32.9 million, or 3.2%, and was the
result of increases in payroll, equipment maintenance and insurance costs, which were driven by increases in
volume and inÖation, partially oÅset by lower other operating expenses. Operating expenses at SAC Holdings,
before consolidating entries, were $108.4 million in Ñscal 2004, compared with $105.3 million in 2003. This
represents an increase of $3.1 million, or 2.9%, and was the result of inÖationary increases in payroll, property
taxes, utilities and insurance costs. Operating expenses at Real Estate, before consolidating entries, were
$8.1 million in Ñscal 2004, compared with $8.1 million in 2003.
Dealer commissions at U-Haul were $176.2 million in Ñscal 2004, compared with $164.5 million in 2003.
This represents an increase of $11.7 million, or 7.1%, and was driven by increased rentals by our independent
dealers.
Lease expenses at U-Haul, before consolidating entries, were $159.9 million in Ñscal 2004, compared
with $165.0 million in 2003. This represents a reduction of $5.1 million, or 3.1%, and reÖects a reduction in the
amount of rental equipment we leased. Lease expenses at Real Estate, before consolidating entries, were
$2.7 million in Ñscal 2004, compared with $.6 million in 2003. This represents an increase of $2.1 million and
reÖects increases in synthetic lease cost and other expenses.
Depreciation expense, net at U-Haul, before consolidating entries, was $125.1 million in Ñscal 2004, net
of loss on sales of Ñxed assets of $8.4 million, compared with $112.8 million in 2003 which included
$7.0 million of gains in sales of Ñxed assets. The overall increase in depreciation between Ñscal 2004 and Ñscal
2003 is due to losses on the sales of Ñxed assets in 2004 compared to gains on the sales of Ñxed assets in 2003.
Depreciation expense at SAC Holdings, before consolidating entries, was $21.4 million in Ñscal 2004, which is
consistent with the amount recorded in 2003.
Earnings from operations at U-Haul, before consolidating entries, were $140.5 million in Ñscal 2004,
compared with $71.0 million in 2003. This represents an increase of $69.5 million, or 97.8%, and was driven by
increased rentals of our trucks, trailers and self-storage rooms, increased sales of moving and storage related
products and services, operational productivity and improved customer service. Earnings from operations at
SAC Holdings, before consolidating entries, were $64.7 million in Ñscal 2004, compared with $68.8 million in
2003. This represents a decrease of $4.1 million, or 5.9%, and was driven by stable rentals of self-storage
22