Tesco 2007 Annual Report Download - page 97
Download and view the complete annual report
Please find page 97 of the 2007 Tesco annual report below. You can navigate through the pages in the report by either clicking on the pages listed below, or by using the keyword search tool below to find specific information within the annual report.-
 1
1 -
2
-
3
-
4
-
5
-
6
-
7
-
8
-
9
-
10
-
11
-
12
-
13
-
14
-
15
-
16
-
17
-
18
-
19
-
20
-
21
-
22
-
23
-
24
-
25
-
26
-
27
-
28
-
29
-
30
-
31
-
32
-
33
-
34
-
35
-
36
-
37
-
38
-
39
-
40
-
41
-
42
-
43
-
44
-
45
-
46
-
47
-
48
-
49
-
50
-
51
-
52
-
53
-
54
-
55
-
56
-
57
-
58
-
59
-
60
-
61
-
62
-
63
-
64
-
65
-
66
-
67
-
68
-
69
-
70
-
71
-
72
-
73
-
74
-
75
-
76
-
77
-
78
-
79
-
80
-
81
-
82
-
83
-
84
-
85
-
86
-
 87
87 -
 88
88 -
 89
89 -
 90
90 -
 91
91 -
 92
92 -
 93
93 -
 94
94 -
 95
95 -
 96
96 -
 97
97 -
 98
98 -
 99
99 -
 100
100 -
 101
101 -
 102
102 -
 103
103 -
 104
104 -
 105
105 -
 106
106 -
 107
107 -
108
-
109
-
110
-
111
-
112
 |
 |

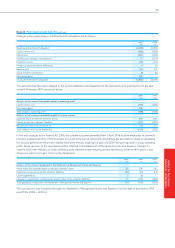
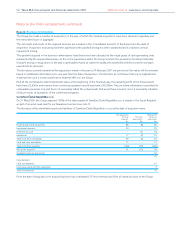
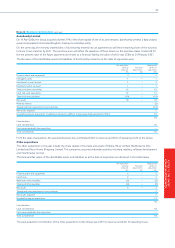
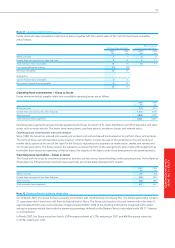
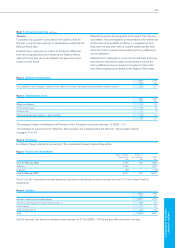
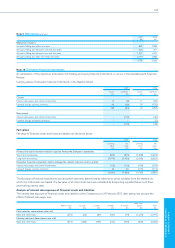
Note 28 Reconciliation of profit before tax to net cash generated from operations
2007 2006
£m £m
Profit before tax 2,653 2,235
Net finance costs 126 127
Share of post-tax profits of joint ventures and associates (106) (82)
Profit on sale of investments in associates (25) –
Operating profit 2,648 2,280
Operating loss of discontinued operation (4) (9)
Depreciation and amortisation 878 838
Profit arising on property-related items (92) (77)
Loss on disposal of non-property assets –4
Net impairment/(reversal of impairment) of property, plant and equipment 19 (5)
Adjustment for non-cash element of pensions charge (113) 58
Share-based payments 185 142
Increase in inventories (420) (146)
Increase in trade and other receivables (81) (38)
Increase in trade and other payables 512 365
Decrease in working capital 11 181
Cash generated from operations 3,532 3,412
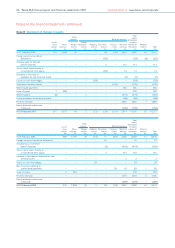
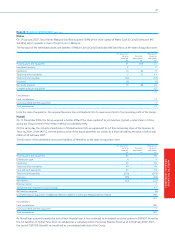
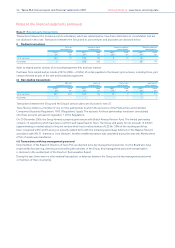
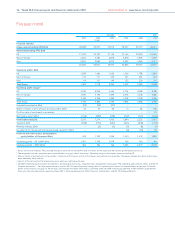
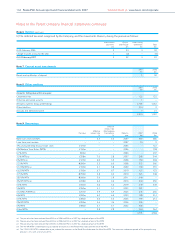
Note 29 Analysis of changes in net debt
Other
At 25 Feb non-cash At 24 Feb
2006 Cash flow movements 2007
£m £m £m £m
Cash and cash equivalents 1,325 (265) (18) 1,042
Finance lease receivables 17 (5) – 12
Derivative financial instruments 70 (61) 99 108
Cash and receivables 1,412 (331) 81 1,162
Bank and other borrowings (1,626) 442 (334) (1,518)
Finance lease payables (20) 7 (23) (36)
Derivative financial instruments and other liabilities (239) 232 (80) (87)
Debt due within one year (1,885) 681 (437) (1,641)
Bank and other borrowings (3,658) (819) 478 (3,999)
Finance lease payables (84) (86) 23 (147)
Derivative financial instruments and other liabilities (294) 22 (127) (399)
Debt due after one year (4,036) (883) 374 (4,545)
(4,509) (533) 18 (5,024)
95
NOTES TO THE GROUP
FINANCIAL STATEMENTS