Tesco 2007 Annual Report Download - page 59
Download and view the complete annual report
Please find page 59 of the 2007 Tesco annual report below. You can navigate through the pages in the report by either clicking on the pages listed below, or by using the keyword search tool below to find specific information within the annual report.-
 1
1 -
2
-
3
-
4
-
5
-
6
-
7
-
8
-
9
-
10
-
11
-
12
-
13
-
14
-
15
-
16
-
17
-
18
-
19
-
20
-
21
-
22
-
23
-
24
-
25
-
26
-
27
-
28
-
29
-
30
-
31
-
32
-
33
-
34
-
35
-
36
-
37
-
38
-
39
-
40
-
41
-
42
-
43
-
44
-
45
-
46
-
47
-
48
-
 49
49 -
 50
50 -
 51
51 -
 52
52 -
 53
53 -
 54
54 -
 55
55 -
 56
56 -
 57
57 -
 58
58 -
 59
59 -
 60
60 -
 61
61 -
 62
62 -
 63
63 -
 64
64 -
 65
65 -
 66
66 -
 67
67 -
 68
68 -
 69
69 -
70
-
71
-
72
-
73
-
74
-
75
-
76
-
77
-
78
-
79
-
80
-
81
-
82
-
83
-
84
-
85
-
86
-
87
-
88
-
89
-
90
-
91
-
92
-
93
-
94
-
95
-
96
-
97
-
98
-
99
-
100
-
101
-
102
-
103
-
104
-
105
-
106
-
107
-
108
-
109
-
110
-
111
-
112
 |
 |

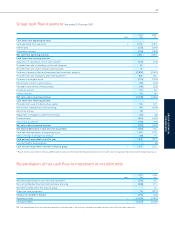
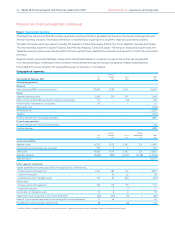
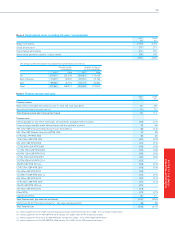
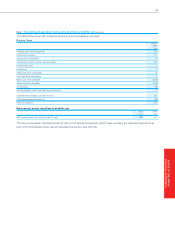
Note 2 Segmental reporting continued
Rest of
UK Europe Asia Total
Year ended 25 February 2006 £m £m £m £m
Continuing operations
Revenue
Sales (excluding VAT) to external customers 29,990 5,095 4,369 39,454
Result
Segment operating profit 1,788 263 229 2,280
Share of post-tax profit from joint ventures and associates 78 – 4 82
Net finance costs (127)
Profit before tax 2,235
Taxation (649)
Profit for the year from continuing operations 1,586
Discontinued operation
Loss for the year from discontinued operation (10)
Profit for the year 1,576
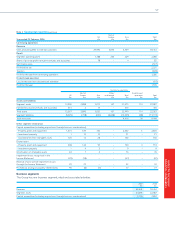
Continuing operations
Rest of Other/ Discontinued
UK Europe Asia unallocated Total operation Total
£m £m £m £m £m £m £m
Assets and liabilities
Segment assets 14,906 3,888 3,012 167 21,973 114 22,087
Investments in joint ventures and associates 461 2 13 – 476 – 476
Total assets 15,367 3,890 3,025 167 22,449 114 22,563
Segment liabilities (5,025) (708) (692) (6,608) (13,033) (86) (13,119)
Total net assets 9,416 28 9,444
Other segment information
Capital expenditure (including acquisitions through business combinations):
– Property, plant and equipment 1,673 549 440 – 2,662 3 2,665
– Investment property 1 10 10 – 21 – 21
– Goodwill and other intangible assets 126 12 28 – 166 – 166
Depreciation:
– Property, plant and equipment 508 146 95 – 749 4 753
– Investment property – 4 5 – 9 – 9
Amortisation of intangible assets 63 7 6 – 76 – 76
Impairment losses recognised in the
Income Statement (29) (18) – – (47) – (47)
Reversal of prior period impairment losses
through the Income Statement 29 23 – – 52 – 52
Profit/(loss) arising on property-related items 90 (6) (7) – 77 – 77
Business segments
The Group has one business segment, retail and associated activities.
2007 2006
£m £m
Revenue 42,641 39,454
Segment assets 24,493 22,087
Capital expenditure (including acquisitions through business combinations) 3,794 2,852
57
NOTES TO THE GROUP
FINANCIAL STATEMENTS