Tesco 2007 Annual Report Download - page 6
Download and view the complete annual report
Please find page 6 of the 2007 Tesco annual report below. You can navigate through the pages in the report by either clicking on the pages listed below, or by using the keyword search tool below to find specific information within the annual report.-
 1
1 -
 2
2 -
 3
3 -
 4
4 -
 5
5 -
 6
6 -
 7
7 -
 8
8 -
 9
9 -
 10
10 -
 11
11 -
 12
12 -
 13
13 -
 14
14 -
 15
15 -
 16
16 -
 17
17 -
18
-
19
-
20
-
21
-
22
-
23
-
24
-
25
-
26
-
27
-
28
-
29
-
30
-
31
-
32
-
33
-
34
-
35
-
36
-
37
-
38
-
39
-
40
-
41
-
42
-
43
-
44
-
45
-
46
-
47
-
48
-
49
-
50
-
51
-
52
-
53
-
54
-
55
-
56
-
57
-
58
-
59
-
60
-
61
-
62
-
63
-
64
-
65
-
66
-
67
-
68
-
69
-
70
-
71
-
72
-
73
-
74
-
75
-
76
-
77
-
78
-
79
-
80
-
81
-
82
-
83
-
84
-
85
-
86
-
87
-
88
-
89
-
90
-
91
-
92
-
93
-
94
-
95
-
96
-
97
-
98
-
99
-
100
-
101
-
102
-
103
-
104
-
105
-
106
-
107
-
108
-
109
-
110
-
111
-
112
 |
 |

4Tesco PLC Annual report and financial statements 2007 Find out more at www.tesco.com/corporate
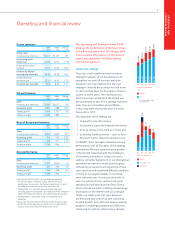
Group performance
These results represent very good progress across
the Group and have been achieved by investing
to improve the shopping experience for
customers in our businesses around the world.
We have been able to deliver another solid sales
performance, and through good cost control and
productivity improvements we have grown profits
faster than revenue – and thereby improved
returns for shareholders. These improvements
have been achieved whilst continuing to invest in
the long term – in the people, assets, processes
and systems, which will enable Tesco to sustain
its success in the future.
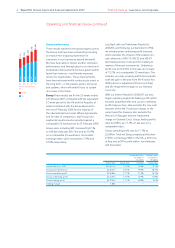
Group These results are for the 52 weeks ended
24 February 2007, compared with the equivalent
52-week period for the UK and the Republic of
Ireland combined with the 60-week period to
the end of February 2006 for the majority of
the international businesses. Where appropriate,
and for ease of comparison, total Group and
segmental results are also reported against a
comparable 52-week period to 25 February 2006.
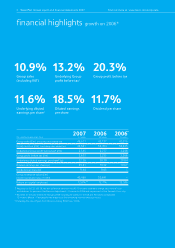
Group sales, including VAT, increased by 8.1%
to £46.6bn (last year £43.1bn) and by 10.9%
on a comparable 52-week basis. At constant
exchange rates, sales increased by 7.9% and
10.8% respectively.
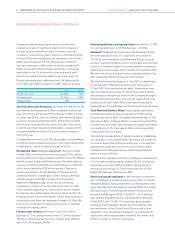
Last April, with our Preliminary Results for
2005/06, and following our transition to IFRS,
we introduced an underlying profit measure,
which excludes the impact of the volatile non-
cash elements of IAS 19, IAS 32 and IAS 39
(principally pension costs and the marking to
market of financial instruments). Underlying
profit rose to £2,545m in the year, an increase
of 13.2% on a comparable 52-week basis. This
includes, as usual, property profits but excludes
both the gain in the year from the Finance Act
2006 pensions adjustment (Pensions A-Day)
and the impairment charge on our Gerrards
Cross site.
With our Interim Results for 2006/07, we also
began reporting segmental trading profit, which
excludes property profits and, as our underlying
profit measure does, also excludes the non-cash
element of the IAS 19 pension charge. In the
current year this measure also excludes the
Pensions A-Day gain and the impairment
charge on Gerrards Cross. Group trading profits
were £2,478m, up 11.1% on last year on a
comparable basis.
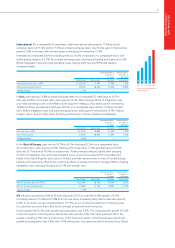
Group operating profit rose by 17.7% to
£2,648m. Total net Group property profits were
£139m, comprising £98m in the UK, a £6m loss
in Asia and a £47m profit within Joint Ventures
and Associates.
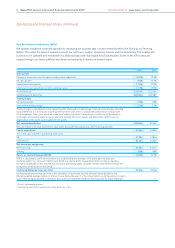
Comparable Basis Statutory Basis
52 weeks vs 52 weeks vs
52 weeks 60 weeks
Actual rates Actual rates Constant Actual rates
Group sales (inc. VAT) £46,611m 10.9% 10.8% 8.1%
Group profit before tax £2,653m 20.3% 19.9% 18.7%
Group operating profit £2,648m 17.7% 17.4% 16.1%
Group underlying profit £2,545m 13.2% 12.9% 11.8%
Group trading profit £2,478m 11.1% 10.8% 9.6%
Trading margin 5.8%–––
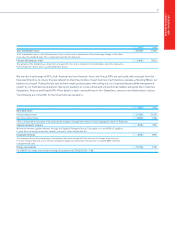
03 04 0605
CAPITAL EXPENDITURE
£m
2,134 1,228
2,285 1,520
07
2,802 1,795
2,990 1,883
2,450 1,704
GROUP
UK
Operating and financial review continued