Tesco 2007 Annual Report Download - page 86
Download and view the complete annual report
Please find page 86 of the 2007 Tesco annual report below. You can navigate through the pages in the report by either clicking on the pages listed below, or by using the keyword search tool below to find specific information within the annual report.-
 1
1 -
2
-
3
-
4
-
5
-
6
-
7
-
8
-
9
-
10
-
11
-
12
-
13
-
14
-
15
-
16
-
17
-
18
-
19
-
20
-
21
-
22
-
23
-
24
-
25
-
26
-
27
-
28
-
29
-
30
-
31
-
32
-
33
-
34
-
35
-
36
-
37
-
38
-
39
-
40
-
41
-
42
-
43
-
44
-
45
-
46
-
47
-
48
-
49
-
50
-
51
-
52
-
53
-
54
-
55
-
56
-
57
-
58
-
59
-
60
-
61
-
62
-
63
-
64
-
65
-
66
-
67
-
68
-
69
-
70
-
71
-
72
-
73
-
74
-
75
-
 76
76 -
 77
77 -
 78
78 -
 79
79 -
 80
80 -
 81
81 -
 82
82 -
 83
83 -
 84
84 -
 85
85 -
 86
86 -
 87
87 -
 88
88 -
 89
89 -
 90
90 -
 91
91 -
 92
92 -
 93
93 -
 94
94 -
 95
95 -
 96
96 -
97
-
98
-
99
-
100
-
101
-
102
-
103
-
104
-
105
-
106
-
107
-
108
-
109
-
110
-
111
-
112
 |
 |

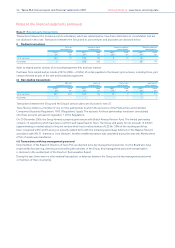
Notes to the financial statements continued
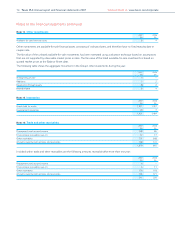
Note 23 Post-employment benefits continued
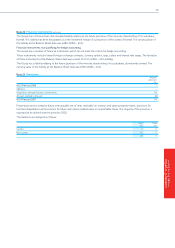
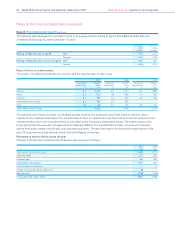
The following table illustrates the expectation of life of an average member retiring at age 65 at the Balance Sheet date and
a member reaching age 65 at the same date +25 years.
At 24 Feb At 25 Feb
2007 2006
in years in years
Retiring at Reporting date at age 65: Male 17.5 17.5
Female 21.9 21.8
Retiring at Reporting date +25 years at age 65: Male 18.4 18.4
Female 23.0 23.0
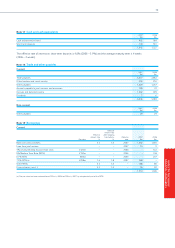
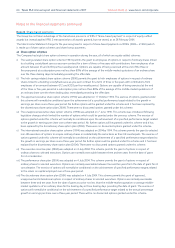
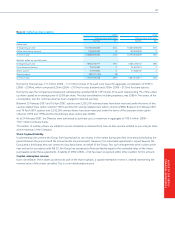
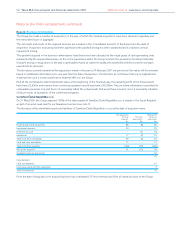
Rates of return on scheme assets
The assets in the defined benefit pension schemes and the expected rates of return were:
2007 2006 2005
Long term Market Long term Market Long term Market
rate of return value rate of return value rate of return value
%£m %£m %£m
Equities 8.1 2,420 8.1 2,134 8.2 1,908
Bonds 5.2 812 4.8 656 5.4 560
Property 6.7 343 6.4 253 6.8 183
Other (alternative assets) 8.1 384 8.1 282 – –
Cash 4.0 48 3.7 123 3.5 67
Total market value of assets 4,007 3,448 2,718
The expected rate of return on assets is a weighted average based on the actual plan assets held and the respective returns
expected on the separate asset classes. The expected rate of return on equities and cash have both been set with reference to the
expected median return over a ten year period, as calculated by the Company’s independent actuary. The median return over a
longer period than ten years was not expected to be materially different. The expected rate of return on bonds was measured
directly from actual market yields for gilts and corporate bond stocks. The rate above takes into account the actual mixture of UK
gilts, UK corporate bonds and overseas bonds held at the Balance Sheet date.
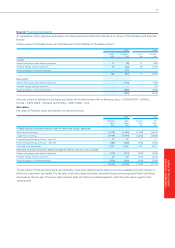
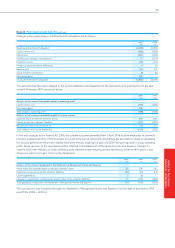
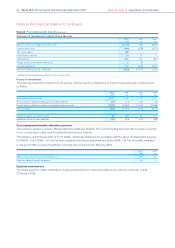
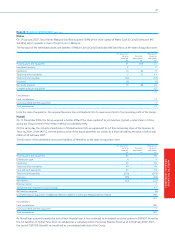
Movement in pension deficit during the year
Changes in the fair value of defined benefit pension plan assets are as follows:
2007 2006
£m £m
Opening fair value of plan assets 3,448 2,718
Expected return 255 209
Actuarial gains 82 309
Contributions by employer 321 270
Actual member contributions 76
Foreign currency translation differences (2) –
Benefits paid (104) (64)
Closing fair value of plan assets 4,007 3,448
84 Tesco PLC Annual report and financial statements 2007 Find out more at www.tesco.com/corporate