Tesco 2007 Annual Report Download - page 7
Download and view the complete annual report
Please find page 7 of the 2007 Tesco annual report below. You can navigate through the pages in the report by either clicking on the pages listed below, or by using the keyword search tool below to find specific information within the annual report.-
 1
1 -
 2
2 -
 3
3 -
 4
4 -
 5
5 -
 6
6 -
 7
7 -
 8
8 -
 9
9 -
 10
10 -
 11
11 -
 12
12 -
 13
13 -
 14
14 -
 15
15 -
 16
16 -
 17
17 -
 18
18 -
19
-
20
-
21
-
22
-
23
-
24
-
25
-
26
-
27
-
28
-
29
-
30
-
31
-
32
-
33
-
34
-
35
-
36
-
37
-
38
-
39
-
40
-
41
-
42
-
43
-
44
-
45
-
46
-
47
-
48
-
49
-
50
-
51
-
52
-
53
-
54
-
55
-
56
-
57
-
58
-
59
-
60
-
61
-
62
-
63
-
64
-
65
-
66
-
67
-
68
-
69
-
70
-
71
-
72
-
73
-
74
-
75
-
76
-
77
-
78
-
79
-
80
-
81
-
82
-
83
-
84
-
85
-
86
-
87
-
88
-
89
-
90
-
91
-
92
-
93
-
94
-
95
-
96
-
97
-
98
-
99
-
100
-
101
-
102
-
103
-
104
-
105
-
106
-
107
-
108
-
109
-
110
-
111
-
112
 |
 |

5
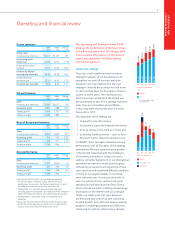
OPERATING AND
FINANCIAL REVIEW
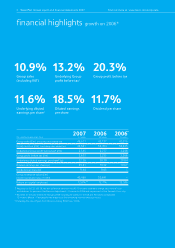
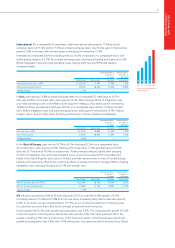
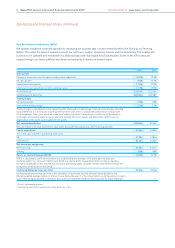
International On a comparable 52 week basis, total international sales grew by 17.9% at actual
exchange rates to £11.0bn and by 17.4% at constant exchange rates. Like-for-like sales in International
grew by 2.0% in the year, with net new space contributing the remaining 15.4%.
International contributed £564m to trading profit, up 18.0% on last year on a comparable basis, with
stable trading margins at 5.7%. At constant exchange rates, international trading profit grew by 16.5%.
Before integration costs and initial operating losses, trading profit rose by 20.9% and margins
increased slightly.
Comparable Basis Statutory Basis
52 weeks vs 52 weeks vs
52 weeks 60 weeks
Actual rates Actual rates Constant Actual rates
International sales (inc. VAT) £11,031m 17.9% 17.4% 5.3%
International trading profit £564m 18.0% 16.5% 10.8%
Trading margin 5.7%–––
In Asia, sales grew by 16.8% at actual exchange rates on a comparable 52 week basis to £4.7bn
(last year £4.0bn). At constant rates, sales grew by 13.5%. After charging £0.3m of integration costs
and initial operating losses on the Makro stores acquired in Malaysia, Asia trading profit increased by
18.8% to £246m at actual rates (last year £207m) on a comparable basis and by 14.5% at constant
rates. Before integration costs and initial operating losses, trading profit increased by 14.7%. Trading
margins rose in Asia to 5.6%, driven by strong performances in Korea, Thailand and Malaysia.
Comparable Basis Statutory Basis
52 weeks vs 52 weeks vs
52 weeks 60 weeks
Actual rates Actual rates Constant Actual rates
Asia sales (inc. VAT) £4,707m 16.8% 13.5% 1.0%
Asia trading profit £246m 18.8% 14.5% 3.4%
Trading margin 5.6%–––
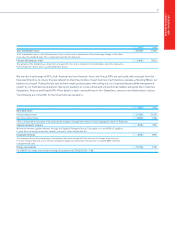
In the Rest of Europe, sales rose by 18.7% to £6.3bn (last year £5.3bn) on a comparable basis.
At constant rates, sales grew by 20.3%. Trading profit increased by 17.3% at actual rates to £318m
(last year £271m) and by 18.0% at constant rates. Trading margins reduced slightly, after charging
£14.0m of integration costs and initial operating losses on the stores acquired from Carrefour and
Edeka in the Czech Republic and Casino in Poland, and with improvements in most of Central Europe,
Ireland and Turkey being offset by the continuing effects of a weak economy in Hungary. Before charging
integration costs, trading profit grew by 22.5% and margins rose.
Comparable Basis Statutory Basis
52 weeks vs 52 weeks vs
52 weeks 60 weeks
Actual rates Actual rates Constant Actual rates
Rest of Europe sales (inc. VAT) £6,324m 18.7% 20.3% 8.7%
Rest of Europe trading profit £318m 17.3% 18.0% 17.3%
Trading margin 5.7%–––
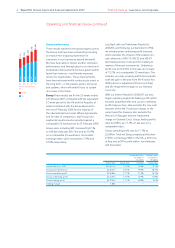
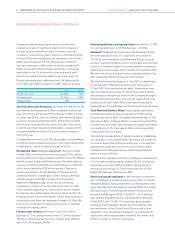
UK UK sales increased by 9.0% to £35.6bn (last year £32.7bn), with like-for-like growth of 5.6%
(including volume of 5.0%) and 3.4% from net new stores. Excluding petrol, like-for-like sales grew by
5.6%. In our stores, we saw modest inflation of 0.2%, as our continued investment in lowering prices
for customers was more than offset by the strength of seasonal fresh food prices.
Fourth quarter like-for-like sales growth, excluding petrol, was 5.8%. This compared with growth of 5.6%
in the third quarter. Including petrol, like-for-like sales grew by 4.9%. Total sales grew by 8.2% in the
quarter, including 3.3% from net new stores. In the final seven weeks of the financial year, like-for-like
growth excluding petrol, was 5.8%, with 4.0% coming from net new stores (which includes Tesco Direct).
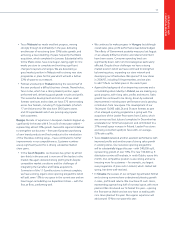
NUMBER OF INTERNATIONAL
HYPERMARKETS
152
03 04 05
194
06
341
411
273
07