Tesco 2007 Annual Report Download - page 88
Download and view the complete annual report
Please find page 88 of the 2007 Tesco annual report below. You can navigate through the pages in the report by either clicking on the pages listed below, or by using the keyword search tool below to find specific information within the annual report.-
 1
1 -
2
-
3
-
4
-
5
-
6
-
7
-
8
-
9
-
10
-
11
-
12
-
13
-
14
-
15
-
16
-
17
-
18
-
19
-
20
-
21
-
22
-
23
-
24
-
25
-
26
-
27
-
28
-
29
-
30
-
31
-
32
-
33
-
34
-
35
-
36
-
37
-
38
-
39
-
40
-
41
-
42
-
43
-
44
-
45
-
46
-
47
-
48
-
49
-
50
-
51
-
52
-
53
-
54
-
55
-
56
-
57
-
58
-
59
-
60
-
61
-
62
-
63
-
64
-
65
-
66
-
67
-
68
-
69
-
70
-
71
-
72
-
73
-
74
-
75
-
76
-
77
-
 78
78 -
 79
79 -
 80
80 -
 81
81 -
 82
82 -
 83
83 -
 84
84 -
 85
85 -
 86
86 -
 87
87 -
 88
88 -
 89
89 -
 90
90 -
 91
91 -
 92
92 -
 93
93 -
 94
94 -
 95
95 -
 96
96 -
 97
97 -
 98
98 -
99
-
100
-
101
-
102
-
103
-
104
-
105
-
106
-
107
-
108
-
109
-
110
-
111
-
112
 |
 |

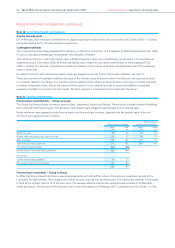
Notes to the financial statements continued
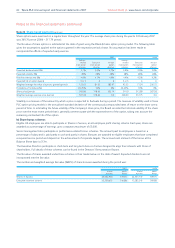
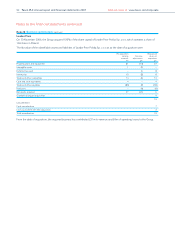
Note 23 Post-employment benefits continued
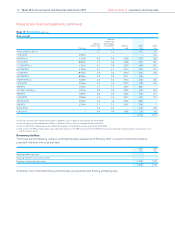
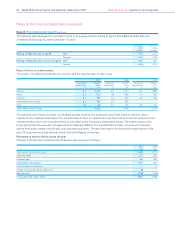
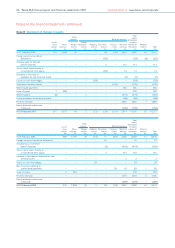
Summary of movements in deficit during the year
2007 2006 2005
£m £m £m
Deficit in schemes at beginning of the year (1,211) (735) (674)
Current service cost (466) (328) (272)
Past service gains 258––
Other finance income 34 25 4
Contributions 321 270 437*
Foreign currency translation differences 2 (1) –
Actuarial gain/(loss) 112 (442) (230)
Deficit in schemes at end of the year (950) (1,211) (735)
* Includes additional contribution of £200m paid in February 2005.
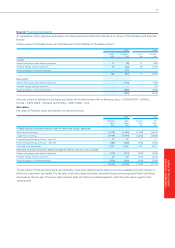
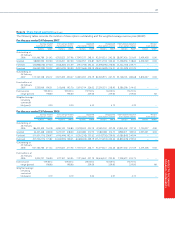
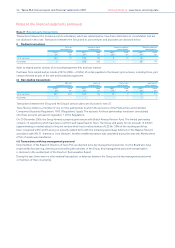
History of movements
The historical movement in defined benefit pension schemes assets and liabilities and history of experience gains and losses are
as follows:
2007 2006 2005 2004
£m £m £m £m
Total market value of assets 4,007 3,448 2,718 1,979
Present value of liabilities relating to unfunded schemes (27) (17) (12) (5)
Present value of liabilities relating to partially funded schemes (4,930) (4,642) (3,441) (2,648)
Pension deficit (950) (1,211) (735) (674)
Experience gains on scheme assets 82 309 66 192
Experience losses on plan liabilities (41) (24) (14) (48)
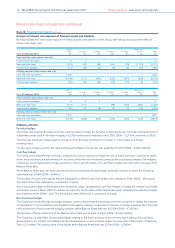
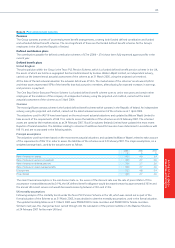
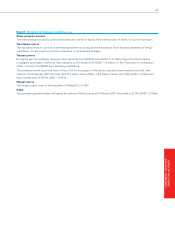
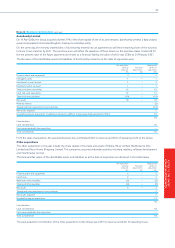
Post-employment benefits other than pensions
The Company operates a scheme offering retirement healthcare benefits. The cost of providing these benefits has been accounted
for on a similar basis to that used for defined benefit pension schemes.
The liability as at 24 February 2007 of £11m (2006 – £10m) was determined in accordance with the advice of independent actuaries.
In 2006/07, £0.5m (2006 – £0.5m) has been charged to the Income Statement and £0.6m (2006 – £0.7m) of benefits were paid.
A change of 1.0% in assumed healthcare cost trend rates would have the following effect:
2007 2006
£m £m
Effect on the annual service and interest cost 0.1 0.1
Effect on defined benefit obligations 1.3 1.0
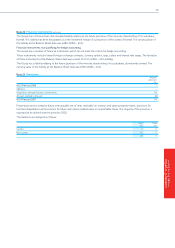
Expected contributions
The Group expects to make contributions of approximately £352m to defined benefit pension schemes in the year ending
23 February 2008.
86 Tesco PLC Annual report and financial statements 2007 Find out more at www.tesco.com/corporate