Tesco 2007 Annual Report Download - page 71
Download and view the complete annual report
Please find page 71 of the 2007 Tesco annual report below. You can navigate through the pages in the report by either clicking on the pages listed below, or by using the keyword search tool below to find specific information within the annual report.-
 1
1 -
2
-
3
-
4
-
5
-
6
-
7
-
8
-
9
-
10
-
11
-
12
-
13
-
14
-
15
-
16
-
17
-
18
-
19
-
20
-
21
-
22
-
23
-
24
-
25
-
26
-
27
-
28
-
29
-
30
-
31
-
32
-
33
-
34
-
35
-
36
-
37
-
38
-
39
-
40
-
41
-
42
-
43
-
44
-
45
-
46
-
47
-
48
-
49
-
50
-
51
-
52
-
53
-
54
-
55
-
56
-
57
-
58
-
59
-
60
-
 61
61 -
 62
62 -
 63
63 -
 64
64 -
 65
65 -
 66
66 -
 67
67 -
 68
68 -
 69
69 -
 70
70 -
 71
71 -
 72
72 -
 73
73 -
 74
74 -
 75
75 -
 76
76 -
 77
77 -
 78
78 -
 79
79 -
 80
80 -
 81
81 -
82
-
83
-
84
-
85
-
86
-
87
-
88
-
89
-
90
-
91
-
92
-
93
-
94
-
95
-
96
-
97
-
98
-
99
-
100
-
101
-
102
-
103
-
104
-
105
-
106
-
107
-
108
-
109
-
110
-
111
-
112
 |
 |

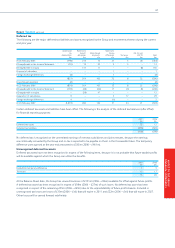
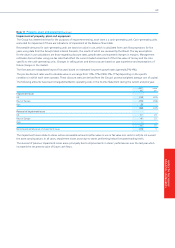
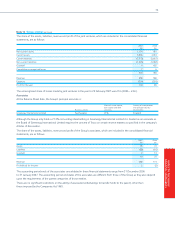
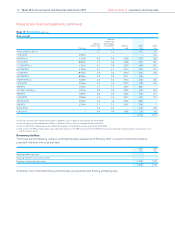
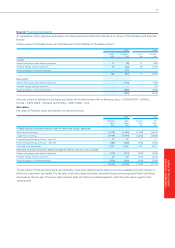
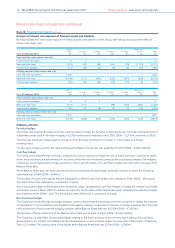
Note 11 Property, plant and equipment continued
Impairment of property, plant and equipment
The Group has determined that for the purposes of impairment testing, each store is a cash-generating unit. Cash-generating units
are tested for impairment if there are indications of impairment at the Balance Sheet date.
Recoverable amounts for cash-generating units are based on value in use, which is calculated from cash flow projections for five
years using data from the Group’s latest internal forecasts, the results of which are reviewed by the Board. The key assumptions
for the value in use calculations are those regarding discount rates, growth rates and expected changes in margins. Management
estimates discount rates using pre-tax rates that reflect the current market assessment of the time value of money and the risks
specific to the cash-generating units. Changes in selling prices and direct costs are based on past experience and expectations of
future changes in the market.
The forecasts are extrapolated beyond five years based on estimated long-term growth rates (generally 3%-4%).
The pre-tax discount rates used to calculate value in use range from 10%-17% (2006: 9%-11%) depending on the specific
conditions in which each store operates. These discount rates are derived from the Group’s post-tax weighted average cost of capital.
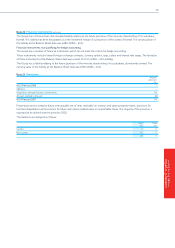
The following amounts have been (charged)/credited to operating costs in the Income Statement during the current and prior year.
2007 2006
£m £m
Impairment losses
UK (44) (29)
Rest of Europe (35) (18)
Asia (3) –
(82) (47)
Reversal of impairment losses
UK 17 29
Rest of Europe 46 23
Asia ––
63 52
Net (impairment)/reversal of impairment losses (19) 5
The impairment losses relate to stores whose recoverable amounts (either value in use or fair value less costs to sell) do not exceed
the asset carrying values. In all cases, impairment losses arose due to stores performing below forecasted trading levels.
The reversal of previous impairment losses arose principally due to improvements in stores’ performances over the last year which
increased the net present value of future cash flows.
69
NOTES TO THE GROUP
FINANCIAL STATEMENTS