Tesco 2007 Annual Report Download - page 4
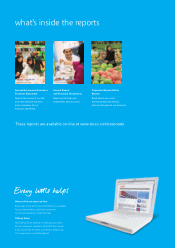
Download and view the complete annual report
Please find page 4 of the 2007 Tesco annual report below. You can navigate through the pages in the report by either clicking on the pages listed below, or by using the keyword search tool below to find specific information within the annual report.-
 1
1 -
 2
2 -
 3
3 -
 4
4 -
 5
5 -
 6
6 -
 7
7 -
 8
8 -
 9
9 -
 10
10 -
 11
11 -
 12
12 -
 13
13 -
 14
14 -
 15
15 -
16
-
17
-
18
-
19
-
20
-
21
-
22
-
23
-
24
-
25
-
26
-
27
-
28
-
29
-
30
-
31
-
32
-
33
-
34
-
35
-
36
-
37
-
38
-
39
-
40
-
41
-
42
-
43
-
44
-
45
-
46
-
47
-
48
-
49
-
50
-
51
-
52
-
53
-
54
-
55
-
56
-
57
-
58
-
59
-
60
-
61
-
62
-
63
-
64
-
65
-
66
-
67
-
68
-
69
-
70
-
71
-
72
-
73
-
74
-
75
-
76
-
77
-
78
-
79
-
80
-
81
-
82
-
83
-
84
-
85
-
86
-
87
-
88
-
89
-
90
-
91
-
92
-
93
-
94
-
95
-
96
-
97
-
98
-
99
-
100
-
101
-
102
-
103
-
104
-
105
-
106
-
107
-
108
-
109
-
110
-
111
-
112
 |
 |

2Tesco PLC Annual report and financial statements 2007 Find out more at www.tesco.com/corporate
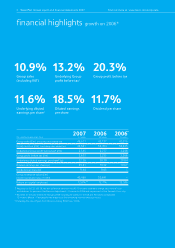
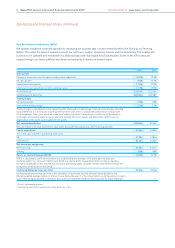
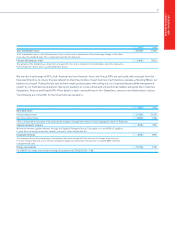
financial highlights growth on 2006*
2007 2006 2006*
On a continuing operations basis 52 weeks 60 weeks 52 weeks
Group sales (£m) (including value added tax) 46,611 43,137 42,016
Group revenue (£m) (excluding value added tax) 42,641 39,454 38,443
Underlying Group profit before tax†(£m) 2,545 2,277 2,248
Group profit before tax (£m) 2,653 2,235 2,206
Underlying diluted earnings per share†(p) 22.36 20.30 20.04
Diluted earnings per share (p) 23.31 19.92 19.67
Dividend per share (p) 9.64 8.63 –
Group enterprise value (£m)
(market capitalisation plus net debt) 40,469 30,841 –
Return on capital employed 12.6% 12.7% 12.5%
† Adjusted for IAS 32, IAS 39, the net difference between the IAS 19 income statement charge and ‘normal’ cash
contributions for pensions, the Pensions Adjustment – Finance Act 2006 and impairment of the Gerrards Cross site.
* Restated for the year ended 25 February 2006 including 52 weeks for the UK and ROI and a comparable
12 months (March – February) for the majority of the remaining International businesses.
Including the one-off gain from Pensions A-Day, ROCE was 13.6%.
10.9%
Group sales
(including VAT)
13.2%
Underlying Group
profit before tax†
20.3%
Group profit before tax
11.6%
Underlying diluted
earnings per share†
18.5%
Diluted earnings
per share
11.7%
Dividend per share
**
**