Suzuki 2009 Annual Report Download - page 6
Download and view the complete annual report
Please find page 6 of the 2009 Suzuki annual report below. You can navigate through the pages in the report by either clicking on the pages listed below, or by using the keyword search tool below to find specific information within the annual report.-
 1
1 -
 2
2 -
 3
3 -
 4
4 -
 5
5 -
 6
6 -
 7
7 -
 8
8 -
 9
9 -
 10
10 -
 11
11 -
 12
12 -
 13
13 -
 14
14 -
 15
15 -
 16
16 -
 17
17 -
18
-
19
-
20
-
21
-
22
-
23
-
24
-
25
-
26
-
27
-
28
-
29
-
30
-
31
-
32
-
33
-
34
-
35
-
36
-
37
-
38
-
39
-
40
-
41
-
42
-
43
-
44
-
45
-
46
-
47
-
48
-
49
-
50
-
51
-
52
 |
 |

SUZUKI MOTOR CORPORATION 5
Year in Review
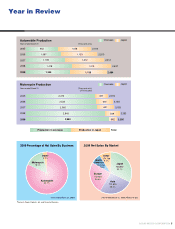
Automobile
81.7%
2009 Percentage of Net Sales By Business
2009 Net Sales By Market
(Year ended March 31, 2009)
*
Marine & Power Products, etc. and Financial Services.
(Year ended March 31, 2009, Millions of yen)
Japan
965,567
32.1%
Other
274,780
9.1%
North
America
234,766
7.8%
Europe
737,945
24.6%
Asia
791,829
26.4%
Other*
3.2%
Motorcycle
15.1%
Automobile Production
Years ended March 31 (Thousand units)
2005 952
1,067
1,199
1,418
1,058
1,133
1,212
1,219
2006
2007
2008
2009
2,010
2,200
2,412
2,637
1,355 1,139 2,494
Overseas Japan
Motorcycle Production
Years ended March 31 (Thousand units)
(ATV included)
2005 2,473
2,533
2,562
2,843
497
605
621
549
2006
2007
2008
2009
2,970
3,138
3,183
3,393
2,984 312 3,295
Overseas Japan
Total
Production in overseas Production in Japan