Suzuki 2009 Annual Report Download - page 44
Download and view the complete annual report
Please find page 44 of the 2009 Suzuki annual report below. You can navigate through the pages in the report by either clicking on the pages listed below, or by using the keyword search tool below to find specific information within the annual report.-
 1
1 -
2
-
3
-
4
-
5
-
6
-
7
-
8
-
9
-
10
-
11
-
12
-
13
-
14
-
15
-
16
-
17
-
18
-
19
-
20
-
21
-
22
-
23
-
24
-
25
-
26
-
27
-
28
-
29
-
30
-
31
-
32
-
33
-
 34
34 -
 35
35 -
 36
36 -
 37
37 -
 38
38 -
 39
39 -
 40
40 -
 41
41 -
 42
42 -
 43
43 -
 44
44 -
 45
45 -
 46
46 -
 47
47 -
 48
48 -
 49
49 -
 50
50 -
 51
51 -
 52
52
 |
 |
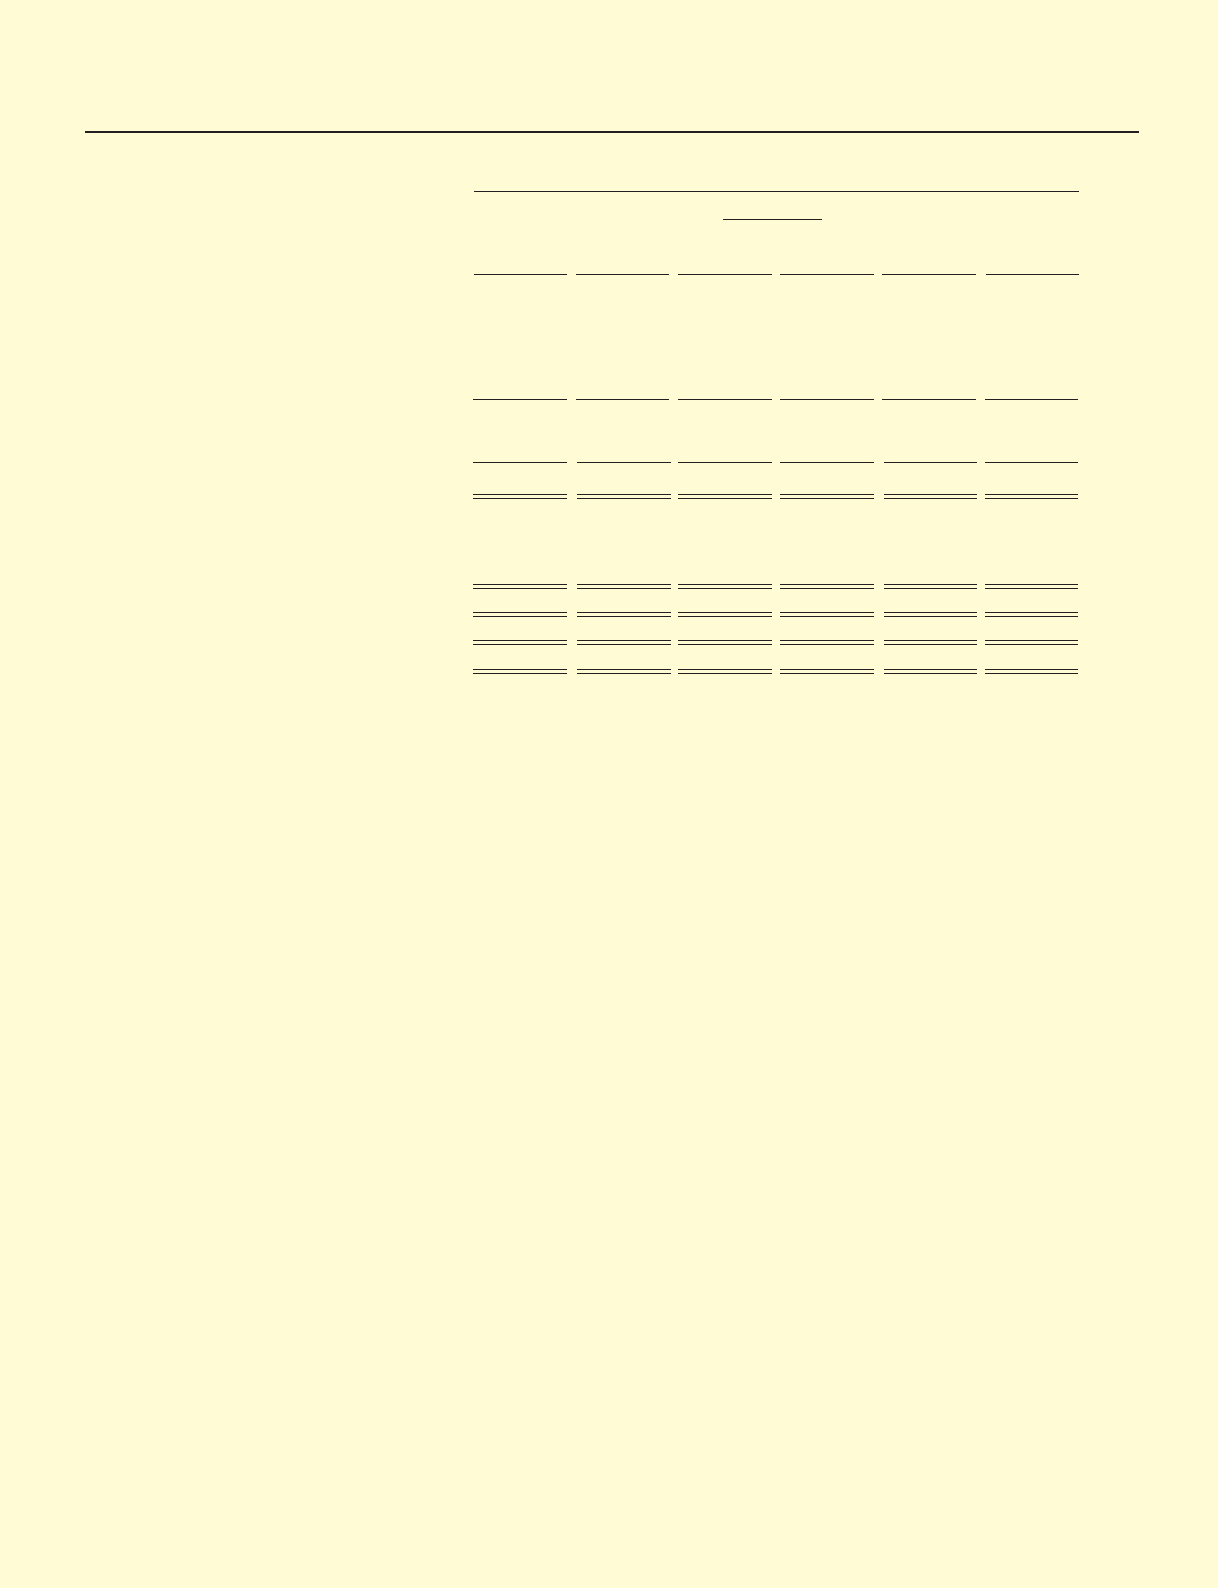
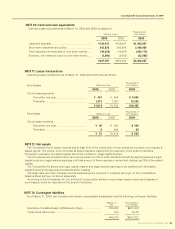
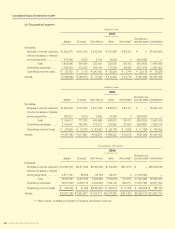
SUZUKI MOTOR CORPORATION 43
Consolidated Financial Statements of 2009
Thousands of U.S. dollars
2009
Marine & Power Financial Eliminations or
Motorcycle Automobile
products, etc. Services corporate assets
Consolidated
Net Sales:
Net sales to external customers ..
$
4,625,359
$24,977,850
$
678,290
$
308,832
$
—
$30,590,332
Internal net sales or transfer
among segments ................... — 717,074 940 492,285
(1,210,300)
—
Total
4,625,359
25,694,924
679,231 801,117
(1,210,300)
30,590,332
Operating expenses ......... 4,690,683
24,991,990
585,217 760,463
(1,221,147)
29,807,208
Operating income (loss) ... $
(65,324)
$
702,934
$
94,013
$
40,653
$
10,847
$
783,124
Assets, depreciation, impairment
loss and capital expenditures:
Assets ............................... $
2,598,264
$13,411,134
$
614,516
$
1,627,814
$3,715,585 $21,967,315
Depreciation ....................... 175,020 1,239,675 22,580 206 — 1,437,482
Impairment loss .................. 56 3,205 240 0 — 3,503
Capital expenditures .......... 213,248 1,826,267 37,163 18 — 2,076,698
Remarks: 1) From this fiscal year, the Suzuki Group has changed indication from “Other” to “Marine and Power
products, etc.” to indicate the business details more clearly.
2) The Suzuki Group has traditionally classified the businesses into three categories of “Motorcycle,”
“Automobile” and “Other”, but from this fiscal year, the Group classifies the businesses into four
categories of “Motorcycle”, “Automobile”, “Marine and Power products, etc.” and “Financial
Services” to indicate the business details of the Group more clearly.
As a result, sales increased by ¥40,102 million for “Automobile”, ¥78,693 million for “Financial
Services” and ¥92 million for “Marine and Power products, etc.”, and sales decreased by ¥118,887
million for “Eliminations or corporate assets” compared to the traditional method for this fiscal year.
Further, operating income decreased by ¥5,058 million for “Automobile” and operating income
increased by ¥3,993 million for “Financial Services” and ¥1,065 million for “Eliminations or corporate
assets”.