Suzuki 2009 Annual Report Download - page 27
Download and view the complete annual report
Please find page 27 of the 2009 Suzuki annual report below. You can navigate through the pages in the report by either clicking on the pages listed below, or by using the keyword search tool below to find specific information within the annual report.-
 1
1 -
2
-
3
-
4
-
5
-
6
-
7
-
8
-
9
-
10
-
11
-
12
-
13
-
14
-
15
-
16
-
 17
17 -
 18
18 -
 19
19 -
 20
20 -
 21
21 -
 22
22 -
 23
23 -
 24
24 -
 25
25 -
 26
26 -
 27
27 -
 28
28 -
 29
29 -
 30
30 -
 31
31 -
 32
32 -
 33
33 -
 34
34 -
 35
35 -
 36
36 -
 37
37 -
38
-
39
-
40
-
41
-
42
-
43
-
44
-
45
-
46
-
47
-
48
-
49
-
50
-
51
-
52
 |
 |

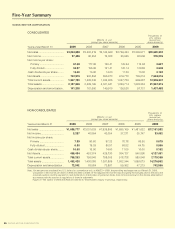
26 SUZUKI MOTOR CORPORATION
Years ended March 31 2009 2008 2007 2006 2005 2009
Net sales .................................. ¥3,004,888 ¥3,502,419 ¥3,163,669 ¥2,746,453 ¥2,365,571 $30,590,332
Net income ............................... 27,429 80,254 75,008 65,945 60,506 279,235
Net income per share:
Primary ................................. 61.68 177.96 169.41 125.64 112.94 0.627
Fully diluted .......................... 53.97 155.89 151.41 122.14 109.86 0.549
Cash dividends per share........ 16.00 16.00 14.00 11.00 10.00 0.162
Net Assets ................................ 742,915 902,894 855,973 616,770 745,016 7,563,016
Total current assets.................. 1,267,790 1,483,038 1,435,405 1,067,709 999,887 12,906,347
Total assets .............................. 2,157,849 2,409,165 2,321,441 1,849,714 1,693,353 21,967,315
Depreciation and amortization . 141,203 161,600 149,910 126,520 97,731 1,437,482
SUZUKI MOTOR CORPORATION
CONSOLIDATED
NON-CONSOLIDATED
Thousands of
U.S. dollars
(except per
share amounts)
Years ended March 31 2009 2008 2007 2006 2005 2009
Net sales .................................. ¥1,685,777 ¥2,031,639 ¥1,939,806 ¥1,690,169 ¥1,481,632 $17,161,532
Net income ............................... 3,287 40,864 43,054 37,271 35,747 33,462
Net income per share:
Primary ................................. 7.39 90.60 97.23 70.78 66.56 0.075
Fully diluted .......................... 6.50 79.39 86.91 68.82 64.75 0.066
Cash dividends per share........ 16.00 16.00 14.00 11.00 10.00 0.162
Net Assets ................................ 405,434 453,374 429,730 364,127 540,890 4,127,401
Total current assets.................. 705,203 758,848 758,005 518,728 589,848 7,179,108
Total assets .............................. 1,402,420 1,430,088 1,381,889 1,082,344 1,098,073 14,276,902
Depreciation and amortization . 72,942 76,584 73,881 59,362 47,213 742,566
Note: Yen amounts are translated into U.S. dollars for convenience only, at
¥
98.23 = US$1, the prevailing exchange rate as of March 31, 2009.
Calculation of net income per share of 2006 and 2005 is made on the adjusted net income basis excluding the bonuses paid to directors and
corporate auditors and the payment of cash dividends to shareholders of preferred stocks from net income shown in the income statements in
accordance with the revision of regulations of financial statements.
Figures in “Net assets” of 2006 and 2005 are referred to “Shareholder’s equity” in previous, respectively.
Millions of yen
(except per share amounts)
Thousands of
U.S. dollars
(except per
share amounts)
Millions of yen
(except per share amounts)
Five-Year Summary