Suzuki 2009 Annual Report Download - page 36
Download and view the complete annual report
Please find page 36 of the 2009 Suzuki annual report below. You can navigate through the pages in the report by either clicking on the pages listed below, or by using the keyword search tool below to find specific information within the annual report.-
 1
1 -
2
-
3
-
4
-
5
-
6
-
7
-
8
-
9
-
10
-
11
-
12
-
13
-
14
-
15
-
16
-
17
-
18
-
19
-
20
-
21
-
22
-
23
-
24
-
25
-
 26
26 -
 27
27 -
 28
28 -
 29
29 -
 30
30 -
 31
31 -
 32
32 -
 33
33 -
 34
34 -
 35
35 -
 36
36 -
 37
37 -
 38
38 -
 39
39 -
 40
40 -
 41
41 -
 42
42 -
 43
43 -
 44
44 -
 45
45 -
 46
46 -
47
-
48
-
49
-
50
-
51
-
52
 |
 |

SUZUKI MOTOR CORPORATION 35
Millions of yen
Millions of yen
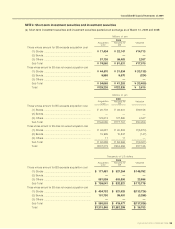
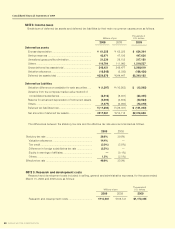
NOTE 4: Short-term investment securities and investment securities
(a) Short-term investment securities and investment securities quoted at an exchange as of March 31, 2009 and 2008
Those whose amount for BS exceeds acquisition cost
(1) Stocks .................................................................. ¥ 17,434 ¥ 32,147 ¥14,713
(2) Bonds ................................................................... —— —
(3) Others .................................................................. 57,126 59,483 2,357
Sub Total ¥ 74,560 ¥ 91,631 ¥17,070
Those whose amount for BS does not exceed acquisition cost
(1) Stocks ................................................................. ¥ 44,670 ¥ 31,534 ¥ (13,135)
(2) Bonds .................................................................. 9,995 9,670 (324)
(3) Others ................................................................. —— —
Sub Total ¥ 54,665 ¥ 41,205 ¥ (13,460)
Total ¥129,226 ¥132,836 ¥ 3,610
Acquisition
Cost Amounts for
BS
Valuation
Those whose amount for BS exceeds acquisition cost
(1) Stocks ................................................................. ¥ 20,772 ¥ 49,931 ¥29,158
(2) Bonds .................................................................. — — —
(3) Others ................................................................. 123,813 127,860 4,047
Sub Total ¥144,585 ¥177,791 ¥33,206
Those whose amount for BS does not exceed acquisition cost
(1) Stocks ................................................................. ¥ 46,681 ¥ 40,808 ¥
(5,873)
(2) Bonds .................................................................. 15,995 15,847 (147)
(3) Others ................................................................. 11 11 —
Sub Total ¥ 62,688 ¥ 56,666 ¥
(6,021)
Total ¥207,273 ¥234,458 ¥27,185
Acquisition
Cost
Amounts for
BS
Valuation
Thousands of U.S. dollars
Those whose amount for BS exceeds acquisition cost
(1) Stocks ................................................................. $ 177,481 $ 327,264 $ 149,782
(2) Bonds .................................................................. —— —
(3) Others ................................................................. 581,559 605,556 23,996
Sub Total $ 759,041 $ 932,821 $ 173,779
Those whose amount for BS does not exceed acquisition cost
(1) Stocks ................................................................. $ 454,752 $ 321,025 $(133,726)
(2) Bonds .................................................................. 101,750 98,451 (3,299)
(3) Others ................................................................. —— —
Sub Total $ 556,503 $ 419,477 $(137,026)
Total $1,315,545 $1,352,298 $ 36,753
Acquisition
Cost Amounts for
BS
Valuation
2009
2008
2009
Consolidated Financial Statements of 2009