Suzuki 2009 Annual Report Download - page 41
Download and view the complete annual report
Please find page 41 of the 2009 Suzuki annual report below. You can navigate through the pages in the report by either clicking on the pages listed below, or by using the keyword search tool below to find specific information within the annual report.-
 1
1 -
2
-
3
-
4
-
5
-
6
-
7
-
8
-
9
-
10
-
11
-
12
-
13
-
14
-
15
-
16
-
17
-
18
-
19
-
20
-
21
-
22
-
23
-
24
-
25
-
26
-
27
-
28
-
29
-
30
-
 31
31 -
 32
32 -
 33
33 -
 34
34 -
 35
35 -
 36
36 -
 37
37 -
 38
38 -
 39
39 -
 40
40 -
 41
41 -
 42
42 -
 43
43 -
 44
44 -
 45
45 -
 46
46 -
 47
47 -
 48
48 -
 49
49 -
 50
50 -
 51
51 -
52
 |
 |

40 SUZUKI MOTOR CORPORATION
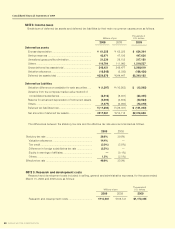
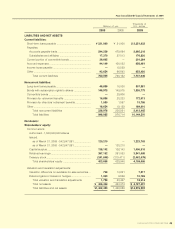
NOTE 8: Income taxes
Breakdown of deferred tax assets and deferred tax liabilities by their main occurrence causes were as follows.
Thousands of
Millions of yen U.S. dollars
2009 2008 2009
Deferred tax assets
Excess-depreciation ...................................................... ¥ 61,325 ¥ 62,222 $ 624,304
Various reserves ............................................................ 43,971 47,192 447,636
Unrealized gross profits elimination............................... 21,330 28,102 217,150
Others ............................................................................ 119,794 111,960 1,219,527
Gross deferred tax assets total ...................................... 246,421 249,477 2,508,619
Valuation allowance ....................................................... (16,545) (5,030) (168,436)
Deferred tax assets total ................................................ ¥229,876 ¥244,447 $2,340,182
Deferred tax liabilities
Valuation difference on available-for-sale securities ..... ¥ (1,297) ¥ (10,563) $ (13,205)
Variance from the complete market value method of
consolidated subsidiaries ............................................ (6,218) (8,031) (63,305)
Reserve for advanced depreciation of noncurrent assets (3,002) (2,806) (30,563)
Others ............................................................................ (1,377) (6,930) (14,018)
Deferred tax liabilities total............................................. ¥ (11,894) ¥ (28,331) $ (121,092)
Net amounts of deferred tax assets ............................... ¥217,981 ¥216,115 $2,219,089
Consolidated Financial Statements of 2009
The differences between the statutory tax rate and the effective tax rate were summarized as follows.
2009 2008
Statutory tax rate ................................................................ 39.8% 39.8%
Valuation allowance ....................................................... 14.4% —
Tax credit ....................................................................... (3.0%) (3.8%)
Difference in foreign subsidiaries tax rate ..................... (2.5%) —
Equity in earnings of affiliates ........................................ —(0.1%)
Others ............................................................................ 1.2% (2.0%)
Effective tax rate ................................................................ 49.9% 33.9%
Thousands of
Millions of yen U.S. dollars
2009 2008 2009
Research and development costs ................................. ¥114,961 ¥108,741 $1,170,325
NOTE 9: Research and development costs
Research and development costs included in selling, general and administrative expenses, for the years ended
March 31, 2009 and 2008 were as follows: