Suzuki 2009 Annual Report Download - page 50
Download and view the complete annual report
Please find page 50 of the 2009 Suzuki annual report below. You can navigate through the pages in the report by either clicking on the pages listed below, or by using the keyword search tool below to find specific information within the annual report.-
 1
1 -
2
-
3
-
4
-
5
-
6
-
7
-
8
-
9
-
10
-
11
-
12
-
13
-
14
-
15
-
16
-
17
-
18
-
19
-
20
-
21
-
22
-
23
-
24
-
25
-
26
-
27
-
28
-
29
-
30
-
31
-
32
-
33
-
34
-
35
-
36
-
37
-
38
-
39
-
 40
40 -
 41
41 -
 42
42 -
 43
43 -
 44
44 -
 45
45 -
 46
46 -
 47
47 -
 48
48 -
 49
49 -
 50
50 -
 51
51 -
 52
52
 |
 |

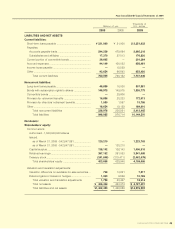
SUZUKI MOTOR CORPORATION 49
Thousands of
Millions of yen U.S. dollars
2009 2008 2009
LIABILITIES AND NET ASSETS
Current liabilities:
Short-term loans payable ............................................... ¥ 231,000 ¥ 21,000 $ 2,351,623
Payables:
Accounts payable-trade.............................................. 294,229 479,694 2,995,316
Subsidiaries and affiliates ........................................... 17,370 27,013 176,830
Current portion of convertible bonds.............................. 29,605 —301,384
Accrued expenses ......................................................... 94,149 100,022 958,461
Income taxes payable .................................................... —15,529 —
Other ............................................................................... 93,654 96,893 953,420
Total current liabilities 760,009 740,152 7,737,036
Noncurrent liabilities:
Long-term loans payable................................................ 49,899 16,030 507,981
Bonds with subscription rights to shares ....................... 149,975 149,975 1,526,773
Convertible bonds .......................................................... —29,606 —
Provision for retirement benefits ..................................... 16,896 20,233 172,013
Provision for directors’ retirement benefits ..................... 1,550 1,587 15,786
Other ............................................................................... 18,654 19,129 189,910
Total noncurrent liabilities 236,976 236,561 2,412,465
Total liabilities 996,985 976,714 10,149,501
Net Assets:
Shareholders’ equity:
Common stock:
Authorized - 1,500,000,000 shares
Issued,
as of March 31, 2009 - 542,647,091 ....................... 120,210 —1,223,763
as of March 31, 2008 - 542,647,091 ....................... —120,210 —
Capital surplus ............................................................ 138,142 138,143 1,406,316
Retained earnings ....................................................... 387,132 391,063 3,941,085
Treasury stock ............................................................. (241,849) (219,471) (2,462,078)
Total shareholders’ equity ...................................... 403,635 429,946 4,109,086
Valuation and translation adjustments:
Valuation difference on available-for-sale securities .. 738 13,861 7,517
Deferred gains or losses on hedges ........................... 1,060 9,566 10,796
Total valuation and translation adjustments 1,798 23,427 18,314
Total net assets ¥ 405,434 453,374 $ 4,127,401
Total liabilities and net assets ¥1,402,420 1,430,088 $14,276,902
Non-Consolidated Financial Statements of 2009