Suzuki 2009 Annual Report Download - page 49
Download and view the complete annual report
Please find page 49 of the 2009 Suzuki annual report below. You can navigate through the pages in the report by either clicking on the pages listed below, or by using the keyword search tool below to find specific information within the annual report.-
 1
1 -
2
-
3
-
4
-
5
-
6
-
7
-
8
-
9
-
10
-
11
-
12
-
13
-
14
-
15
-
16
-
17
-
18
-
19
-
20
-
21
-
22
-
23
-
24
-
25
-
26
-
27
-
28
-
29
-
30
-
31
-
32
-
33
-
34
-
35
-
36
-
37
-
38
-
 39
39 -
 40
40 -
 41
41 -
 42
42 -
 43
43 -
 44
44 -
 45
45 -
 46
46 -
 47
47 -
 48
48 -
 49
49 -
 50
50 -
 51
51 -
 52
52
 |
 |

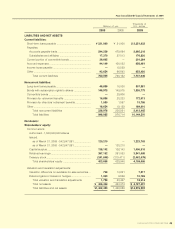
48 SUZUKI MOTOR CORPORATION
Thousands of
SUZUKI MOTOR CORPORATION
Millions of yen U.S. dollars
2009 2008 2009
ASSETS
Current assets:
Cash and deposits ......................................................... ¥ 50,322 ¥ 48,758 $ 512,295
Short-term investment securities .................................... 284,019 217,110 2,891,370
Receivables:
Notes and accounts receivable-trade ........................ 61,991 80,887 631,080
Subsidiaries and affiliates ........................................... 91,121 106,278 927,638
Less allowance for doubtful accounts ........................ (46) (72) (468)
Merchandise and finished goods ................................... 58,607 93,398 596,630
Work in process .............................................................. 18,863 17,022 192,031
Raw materials and supplies ........................................... 9,500 8,430 96,713
Other ............................................................................... 130,824 187,034 1,331,816
Total current assets 705,203 758,848 7,179,108
Property, plant and equipment:
Land................................................................................ 84,677 80,654 862,037
Buildings and structures................................................. 212,974 186,383 2,168,120
Machinery, equipment and vehicles .............................. 714,141 646,029 7,270,097
Construction in progress ................................................ 4,033 21,025 41,063
1,015,827 934,092 10,341,318
Less accumulated depreciation.................................. (770,735) (717,503) (7,846,236)
Total property, plant and equipment 245,091 216,589 2,495,081
Investments and other assets:
Investment securities ...................................................... 91,197 123,926 928,407
Investments in subsidiaries and affiliates ....................... 221,347 217,474 2,253,360
Other ............................................................................... 139,579 113,249 1,420,944
Total investments and other assets 452,124 454,650 4,602,712
Total assets ¥1,402,420 ¥1,430,088 $14,276,902
Non-Consolidated Balance Sheets
As of March 31, 2009 and 2008
Non-Consolidated Financial Statements of 2009